At a glance
| Built-in UI | RisingWave Console | |
|---|---|---|
| What it is | The web UI that ships with every RisingWave cluster (also referred to as the RisingWave Dashboard in CLI flags). | A separate self-hosted operations console from RisingWave Labs. |
| How to get it | Included automatically — no extra setup. | Premium feature. Contact sales@risingwave-labs.com to obtain the image, binary, and signed RisingWave license key. |
| Where it runs | Served by the meta node on port 5691 by default (e.g. http://localhost:5691). | Runs as its own service (Docker / binary) on port 8020 by default, backed by a PostgreSQL metadata database. |
| Scope | Read-only inspection of a single cluster. | Multi-cluster operations, with workflows that go beyond what the meta node exposes. |
| Primary use cases | Inspect catalog objects, view streaming fragment graphs, debug with await tree dumps and heap profiling. | Manage many clusters from one place, run risectl, automate metadata snapshots, collect diagnostics, and run SQL across environments. |
| Audience | Anyone running RisingWave. | DevOps / SRE teams operating production deployments. |
Which one should I use?
- If you just installed RisingWave and want to look inside the cluster — open the built-in UI at
http://localhost:5691. There is nothing to install. - If you operate multiple RisingWave clusters and need centralized management, automated backups, diagnostic collection, or
risectlaccess from a UI — request RisingWave Console from RisingWave Labs.
Built-in UI
The built-in UI is part of every RisingWave deployment. The meta node serves it as a static web app on port5691, so as long as that port is reachable you can open it in a browser without installing anything else.
From the built-in UI you can:
- Browse catalog objects: sources, tables, materialized views, indexes, internal tables, sinks, views, subscriptions, and functions.
- Visualize streaming execution with fragment graphs, including back-pressure rates.
- Inspect batch task execution.
- Debug with await tree dumps, heap profiling, and distributed plan visualization.
RisingWave Console
RisingWave Console is a separate, self-hosted application designed for teams that need additional operational workflows on top of one or more RisingWave clusters.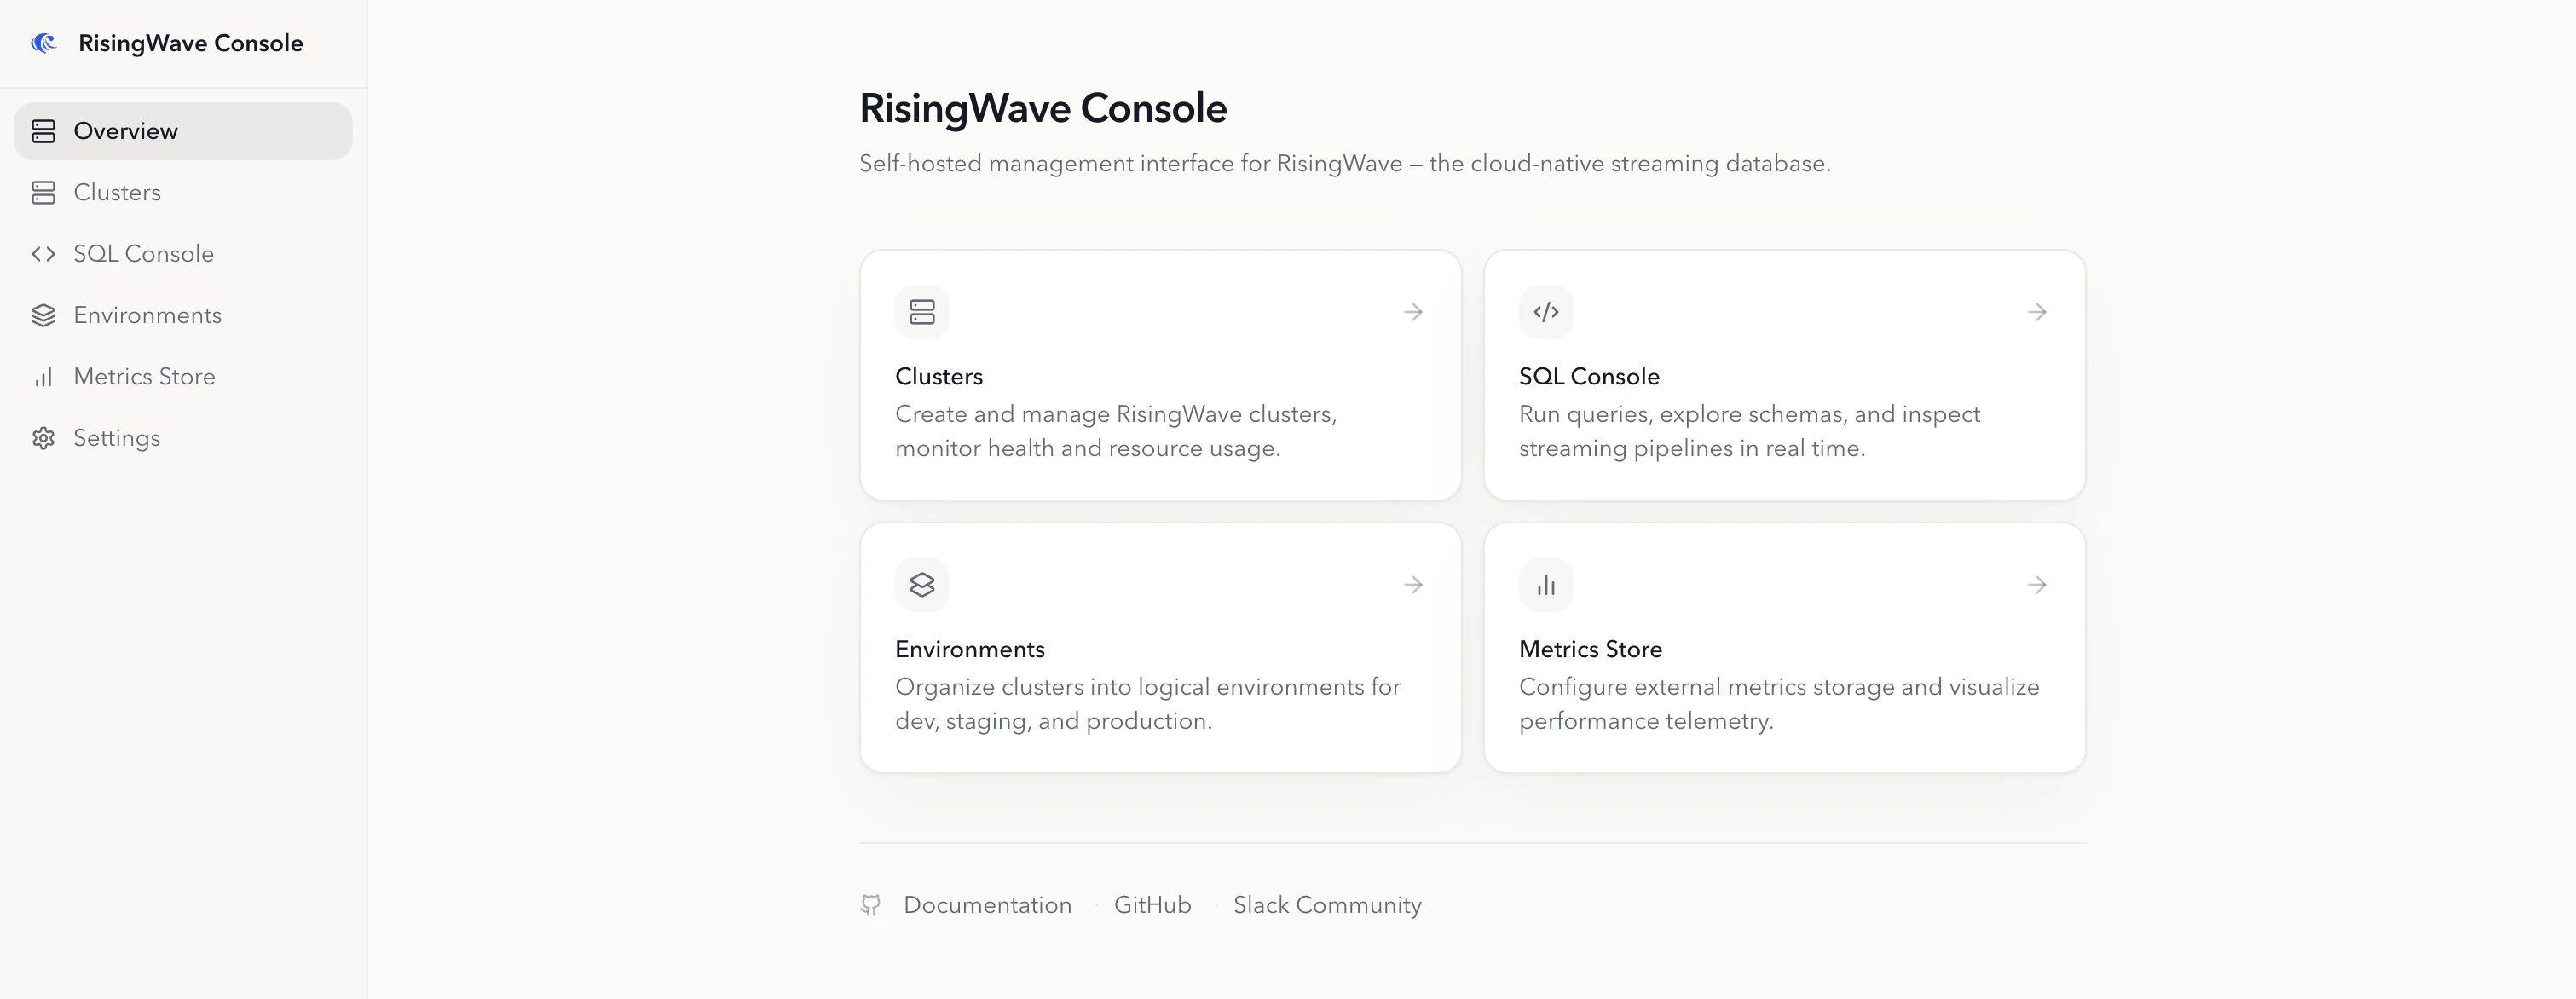
- Cluster lifecycle operations: connect existing clusters for day-2 operations, or create and operate managed RisingWave clusters on Kubernetes.
- Kubernetes environment management: install cert-manager, the RisingWave Operator, object storage, metadata PostgreSQL, metrics, logs, and Grafana with one-click workflows.
- Operational tooling: run
risectlcommands, create metadata snapshots (manual or automated), and collect diagnostic data for troubleshooting. - SQL Console: browse schemas, run SQL in the browser, track DDL progress, and inspect the streaming graph.
- Metrics integration: register Prometheus-compatible metrics stores, view cluster metrics, and export metrics for offline analysis.
- Restricted-network support: configure private registries, local Helm charts, and pre-cached
risectlbinaries for air-gapped deployments.