Overview
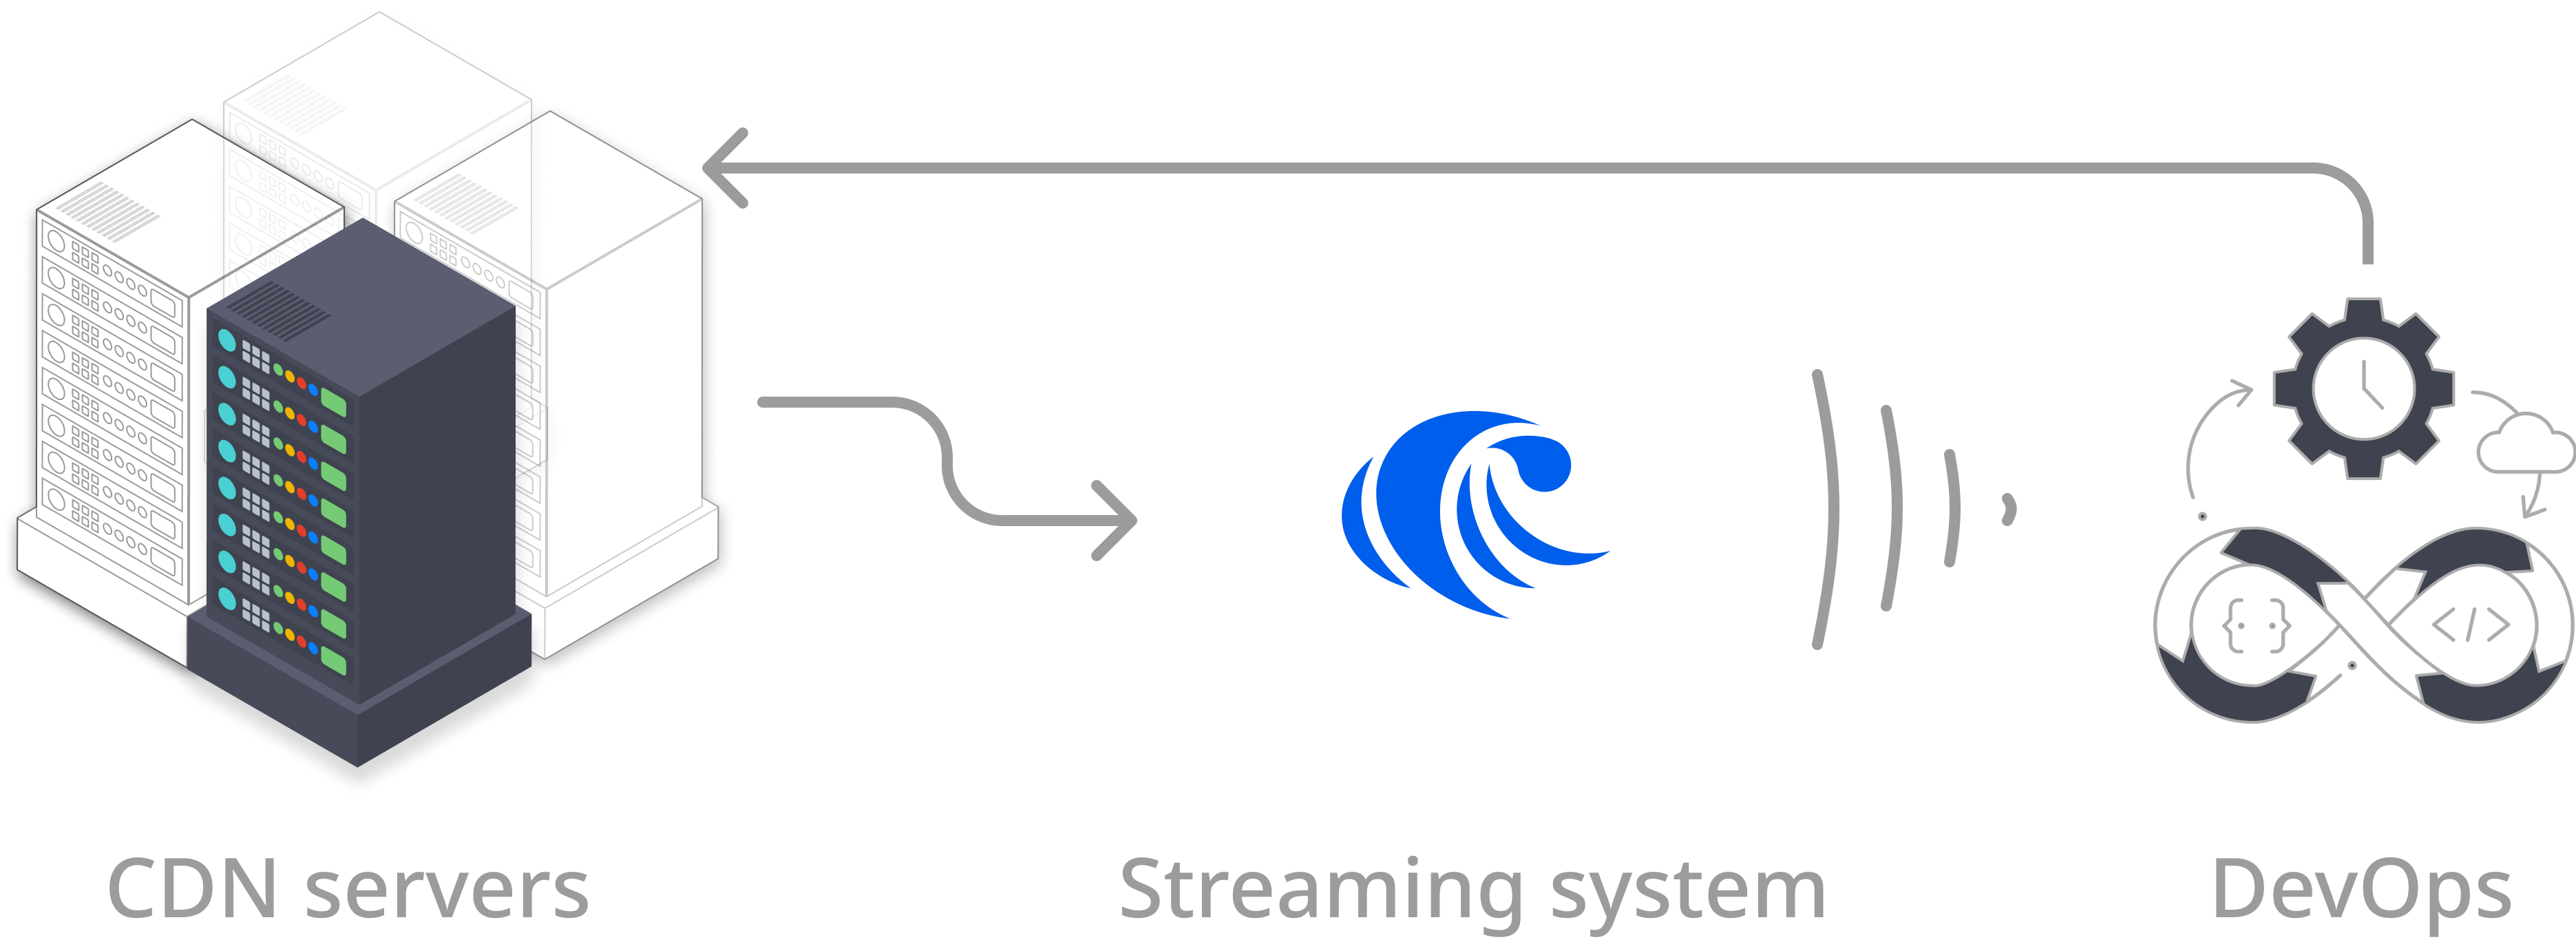
They set up various metrics to monitor server performance, yet diagnosing performance issues is complex and time-consuming, as the volume of diagnostic data can be huge. There is a growing consensus that it should be automated. But how? A streaming system can be beneficial in this scenario. It monitors metric performance events in real time right after these events are received and instantly detects anomalies based on patterns defined in SQL queries. Once a performance issue is detected, a downstream micro-service can trigger an action to handle the issue.
Prerequisites
- Ensure you have Docker and Docker Compose installed in your environment. Note that Docker Compose is included in Docker Desktop for Windows and macOS. If you use Docker Desktop, ensure that it is running before launching the demo cluster.
- Ensure that the PostgreSQL interactive terminal,
psql, is installed in your environment. For detailed instructions, see Download PostgreSQL.
Step 1: Launch the demo cluster
In the demo cluster, we packaged RisingWave and a workload generator. The workload generator will start to generate random traffic and feed them into Kafka as soon as the cluster is started. First, clone the risingwave repository to the environment.integration_tests/cdn-metrics directory and start the demo cluster from the docker compose file.
Step 2: Connect RisingWave to data streams
Now let’s connect to RisingWave so that we can manage data streams and perform data analysis.Step 3: Define materialized views and query the results
In this tutorial, we will create a few different materialized views. The first view,high_util_tcp_metrics, will include average values for all metrics of every device every 3 minutes. The other three views will be derived from the first view, each containing a trigger time and different metric values.
Set up materialized view for highly utilized TCP metrics
First, we will create the materialized view that contains all relevant TCP values. We use the tumble function to map all events into 1-minute windows and calculate the average metric value for each device within each time window. Next, the average TCP and NIC metrics are calculated separately before joining on device names and time windows. We will keep the records measuring the volume of bytes transferred by the interface and where the average utilization is greater than or equal to 50. Please refer to this guide for an explanation of the tumble function and aggregations.Set up materialized views from a materialized view
RisingWave supports creating materialized views based on materialized views. Materialized views used as the source are the upstream materialized views, while the materialized views created based on other materialized views are downstream materialized views. As the values of upstream materialized views change, downstream materialized views will change automatically.
srtt_incidents as an example, but you can query the other two materialized views. Note that your results will differ because the workload generator randomly generates the data in the streams.
Summary
In this tutorial, we learn:- How to set up a streaming pipeline for anomaly detection using RisingWave.
- How to create materialized views based on existing materialized views.