grafanalib:
The source code and generation details can be found at github.com/risingwavelabs/risingwave/tree/main/grafana. The two dashboard scripts are:
- Dev dashboard (
risingwave-dev-dashboard.dashboard.py) — finer-grained metrics covering all components. Recommended for most monitoring needs. - User dashboard (
risingwave-user-dashboard.dashboard.py) — summarizes high-level metrics such as source and sink throughput, barrier latency, cluster alerts, and compute/source/sink streaming error rates.
Resource utilization
Monitoring resource utilization helps you understand how efficiently your cluster is using its CPU, memory, and other resources. High utilization can indicate bottlenecks, while low utilization might suggest opportunities for cost savings.CPU usage
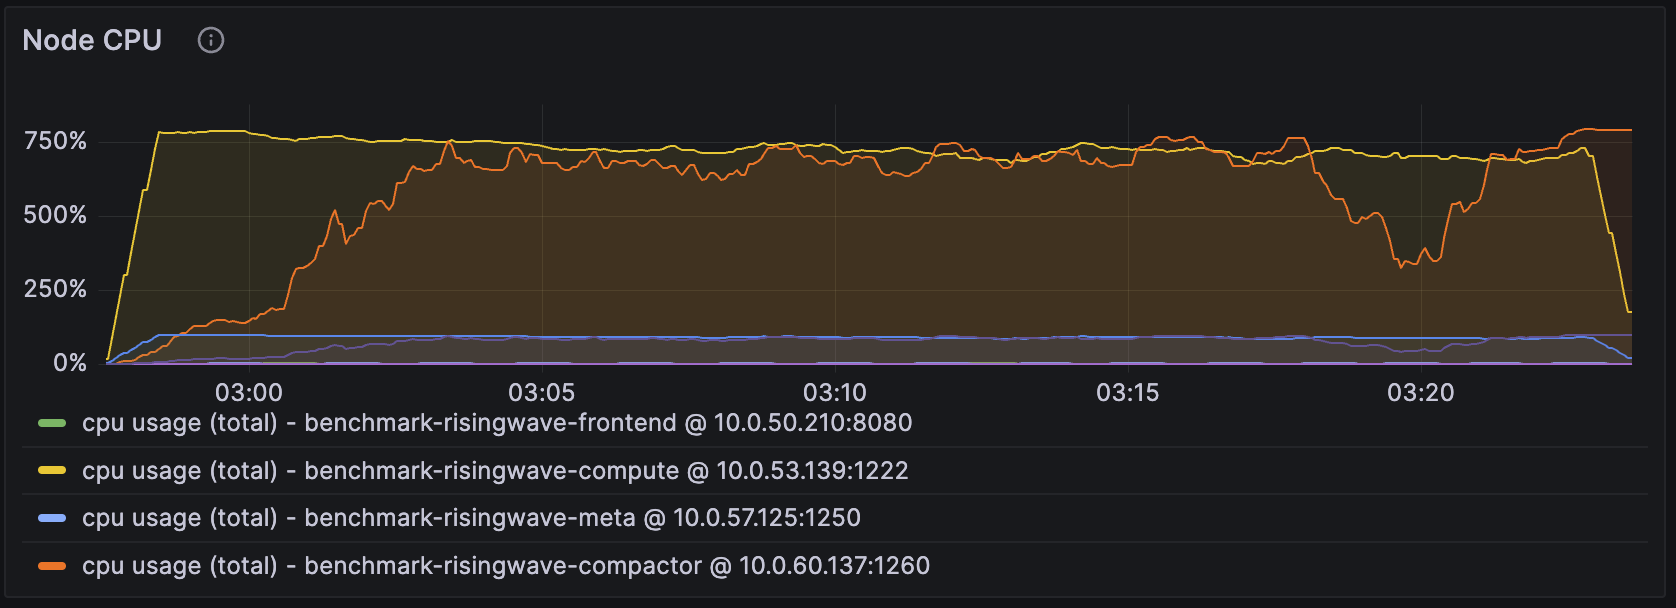
- When the CPU usage of the Streaming Node is close to the total number of CPUs this Node has (i.e., 800% in this case), we can likely improve the performance, e.g., throughput, by adding more CPUs to the Streaming Node.
- We can apply the same reasoning to Compactor Nodes. We will revisit this when we introduce the metrics “LSM Compact Pending Bytes”, which suggests the ideal number of CPUs to reserve for compaction workload.
Memory usage
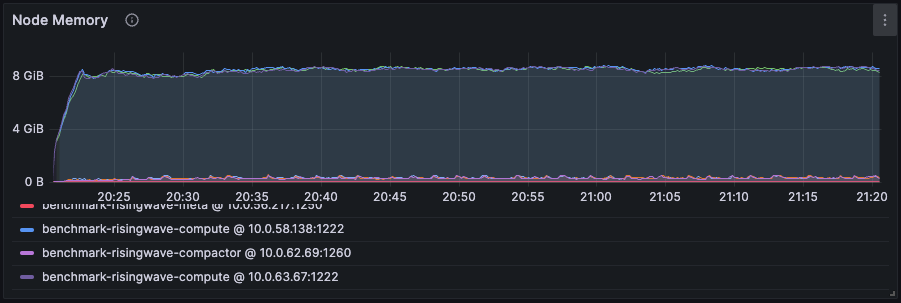
- RisingWave calculates and monitors the memory usage of each component.
- RisingWave reserves 30% of the total memory, i.e., reserved memory, as a buffer. In case of a sudden spike in input data, RisingWave has enough time to adjust its memory usage.
- RisingWave periodically checks the current memory usage against the rest 70% of the total memory, i.e., usable memory, and decides if it should evict data. If it exceeds 70% of usable memory, it gracefully evicts. The eviction will be further intensified if it exceeds 80% and 90%.
- If the memory is kept below 5.88 GB (70% of usable memory), we can be sure that the workload only asks for this amount. In other words, the data/state is completely kept in memory, as the eviction is never triggered. As a result, we can tune down the memory resources to save costs.
- If the memory is higher than 70% of the usable memory, we consider allocating more memory to speed up if the extra cost is acceptable. Additionally, we recommend taking the cache miss ratio below into consideration when making this decision. See Best Practices - Resource Allocation for guidance on adjusting memory. If you are experiencing high latency or slow stream processing, see Troubleshooting - High Latency.
Cache performance
Operators such as join and aggregation are stateful. They maintain intermediate states in their operator cache to facilitate incremental computation. Efficient caching is crucial for minimizing latency and maximizing throughput.Operator cache miss ratios
For example, the following are the cache miss ratio metrics of the join operator, showing the metrics at the actor level. Each operator is parallelized by multiple actors, whose number is equal to thestreaming_parallelism. By default, the parallelism is the same as the number of CPUs on Compute Nodes.
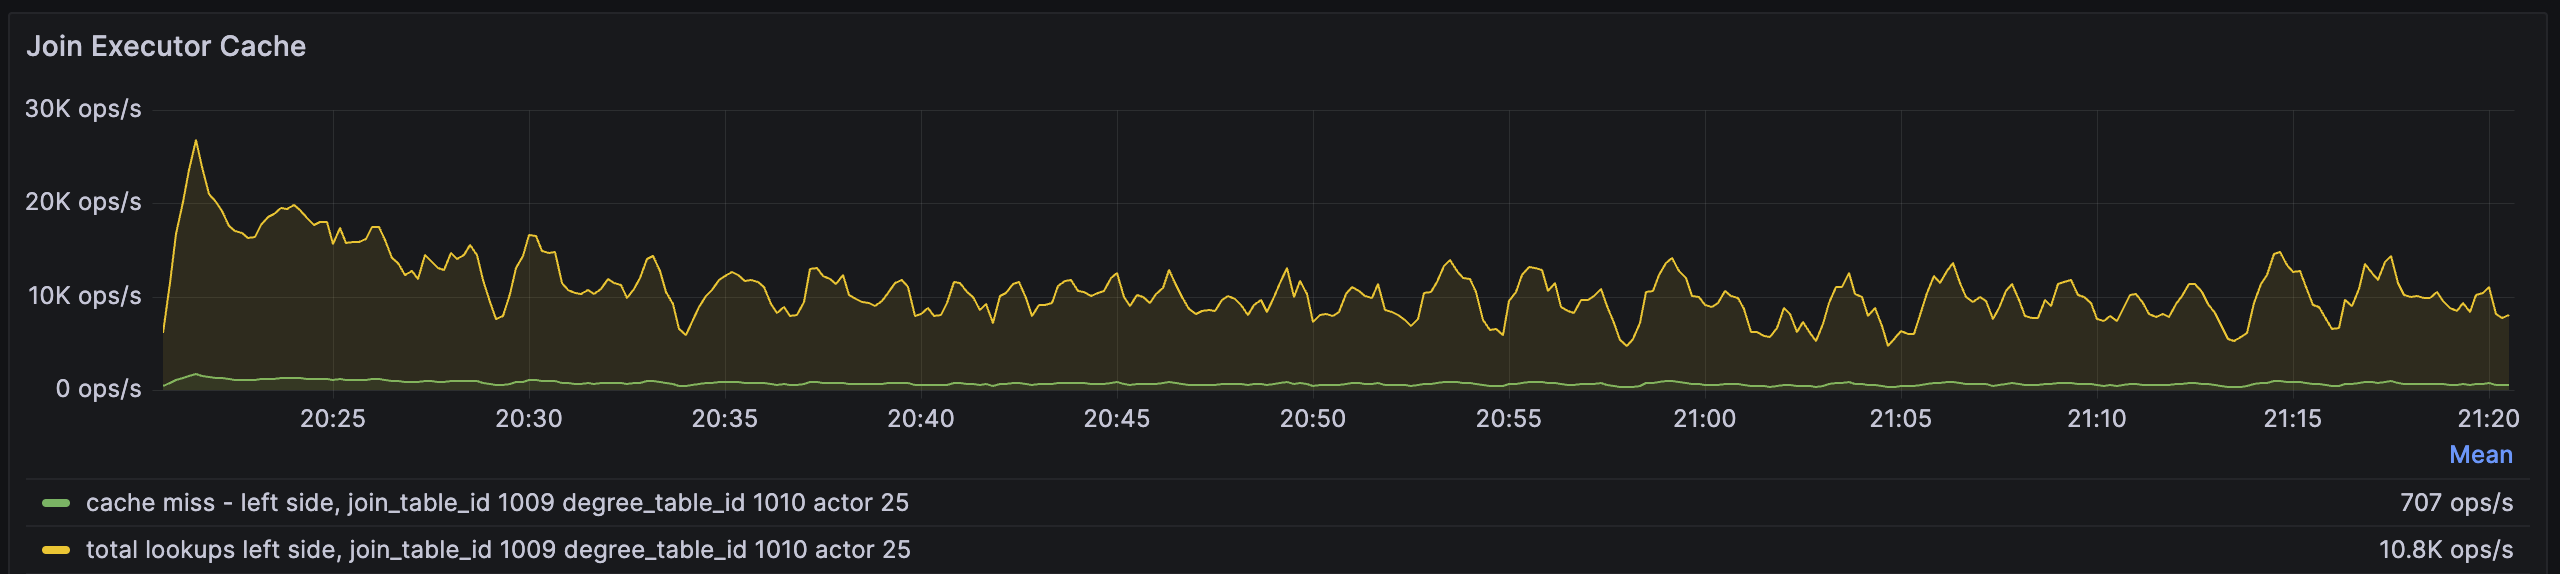
total lookups metric denotes how many lookups a join operator performs per second, and the cache miss metric denotes how many times the key does not exist in the memory and RisingWave has to fetch it from the storage engine.
In the case above, the cache miss rate is 707/10.8K~=6%, which is quite low. Increasing memory may not do too much good.
Below is the same metric but for the aggregation operator.
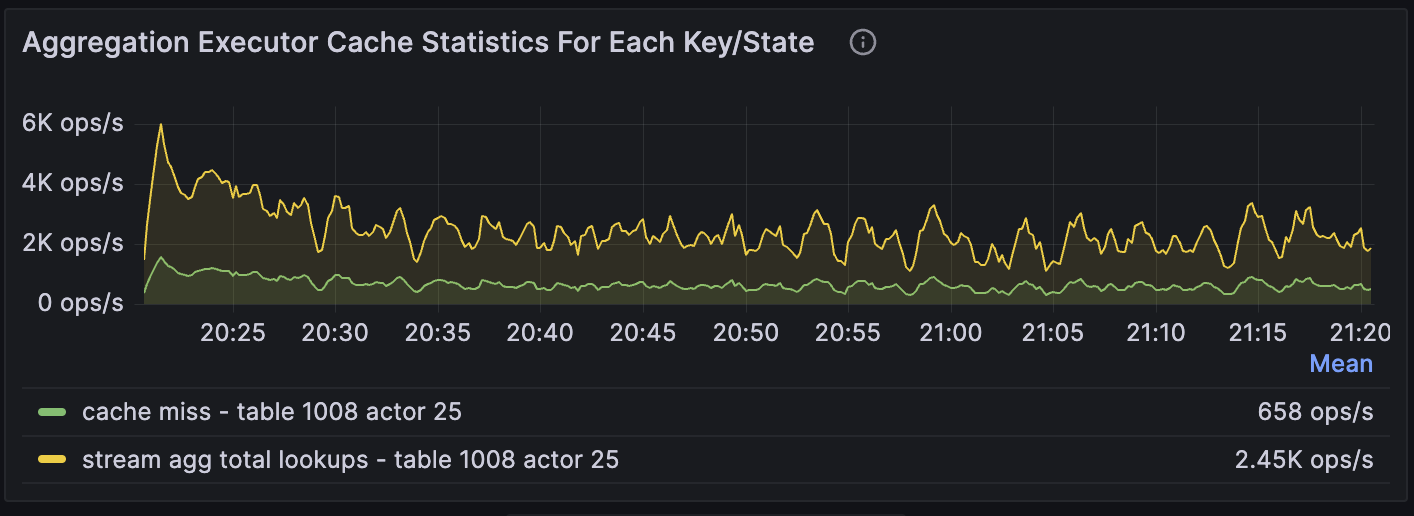
658/2.45K ~= 27%, which is relatively high. It indicates that we are likely to improve the performance if we increase the memory.
Other than the operator cache, the storage engine named Hummock on each Compute Node maintains the block (data) cache and meta cache. The data cache stores data. Unlike the operator cache, the block (data) cache stores everything in its binary/serialized format. And all the operators share the same block cache. The meta cache stores metadata. Hummock requires metadata to locate the data files it needs to read from S3.
We also track the cache miss ratio of these two caches:
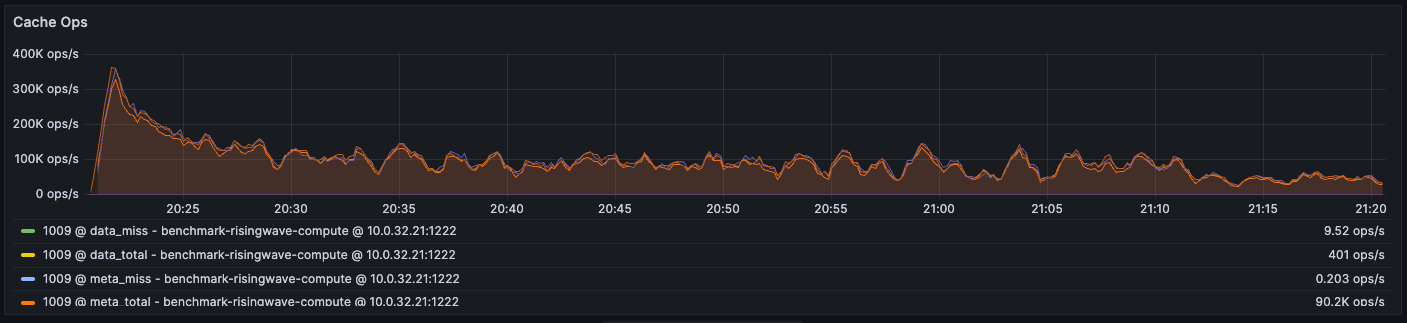
9.52/401 = 2% and the cache miss rate of the meta cache to be 0.203/90.2K ~= 0.0002%.
We notice that the number of total lookups to the meta cache is much higher than the number of total lookups to the data cache. This is because every lookup into the storage requires going through the meta cache, but it does not necessarily access the data cache or remote object storage every time. The meta cache has a bloom filter to check if the data actually exists, reducing the number of remote fetches happening.
It implies that even just a small percentage of cache misses in the meta cache can induce significant performance overhead due to the large total number of misses.
Takeaway
- Monitor the cache miss metrics of the meta cache, the block (data) cache, and all the operator caches (ordered by importance) to estimate the potential room for improvement.
- The number of cache misses is as important as the cache miss ratio because the latency of remote I/Os to object store such as 3 is incurred on each cache miss.
- Whether we want to increase memory to improve performance is both user-dependent and workload-dependent:
- How much extra cost the user can afford
- The number of cache misses may be reduced a little (a lot) if the workload has a weak (strong) data locality.
- If you are experiencing high latency or slow stream processing due to cache misses, see Troubleshooting - High Latency. You may also need to address specific resource bottlenecks as described in Troubleshooting - Specific Bottlenecks.
Compaction
Compaction is a background process that merges and reorganizes data in RisingWave’s storage engine (Hummock) to improve query performance and reclaim storage space.LSM tree compact pending bytes
As described in the CPU usage section, we can estimate the ideal CPU resources allocated for compactors by considering the LSM Tree Compact Pending Bytes.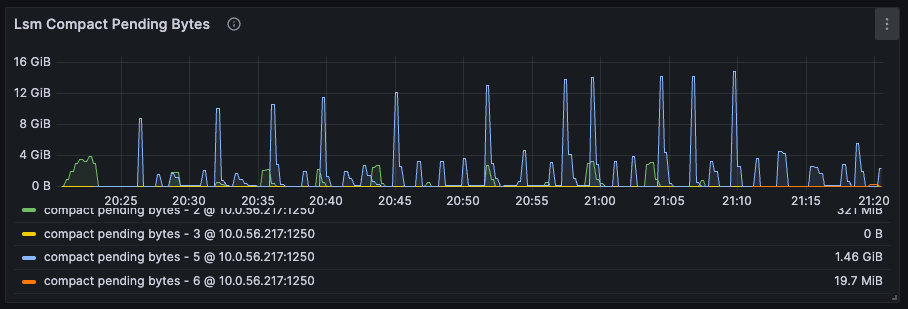
Barrier monitoring
Barriers are a fundamental mechanism for synchronization and consistency in RisingWave. Monitoring barrier metrics is crucial for identifying potential performance issues.Barrier latency and barrier number
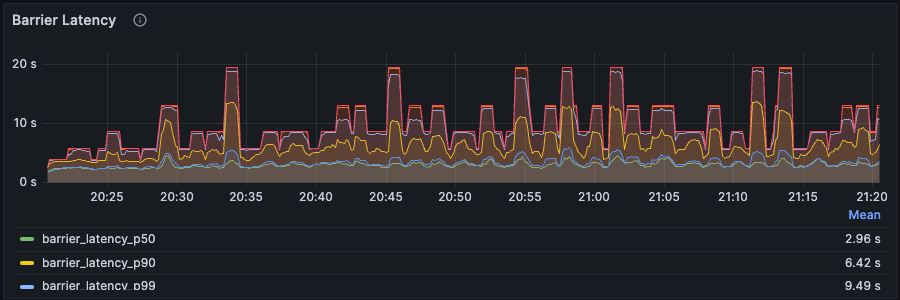
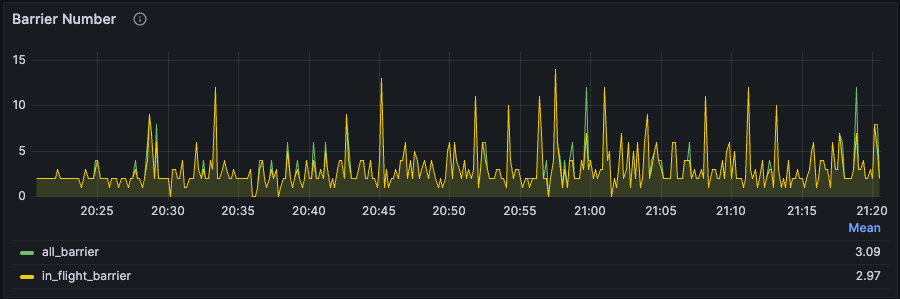
- The barrier latency keeps climbing and never enters a stabilized phase. At the same time, the number of barriers also keeps increasing. This implies that the system is in serious congestion, i.e., the current resource falls short of handling the workload. We likely need to increase CPU or memory resources by checking the other metrics mentioned above. See Troubleshooting - High Latency. Also, see Workload Analysis for a deeper understanding of how backpressure impacts barrier latency.
- The barrier latency and the barrier number fluctuate but still stabilize around a certain level. This is not abnormal. Due to the dynamic nature of streaming data and RisingWave’s dynamic back-pressure mechanism, it is fine to experience such phenomena as RisingWave keeps adjusting at any given second.
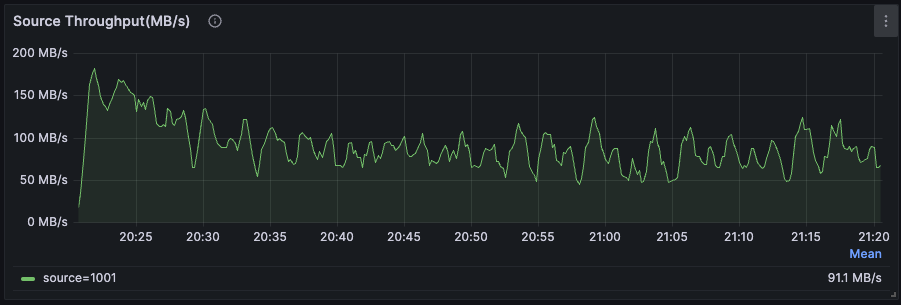
Data ingestion
Monitoring data ingestion metrics helps you understand the rate at which RisingWave is receiving data from upstream sources.Source throughput