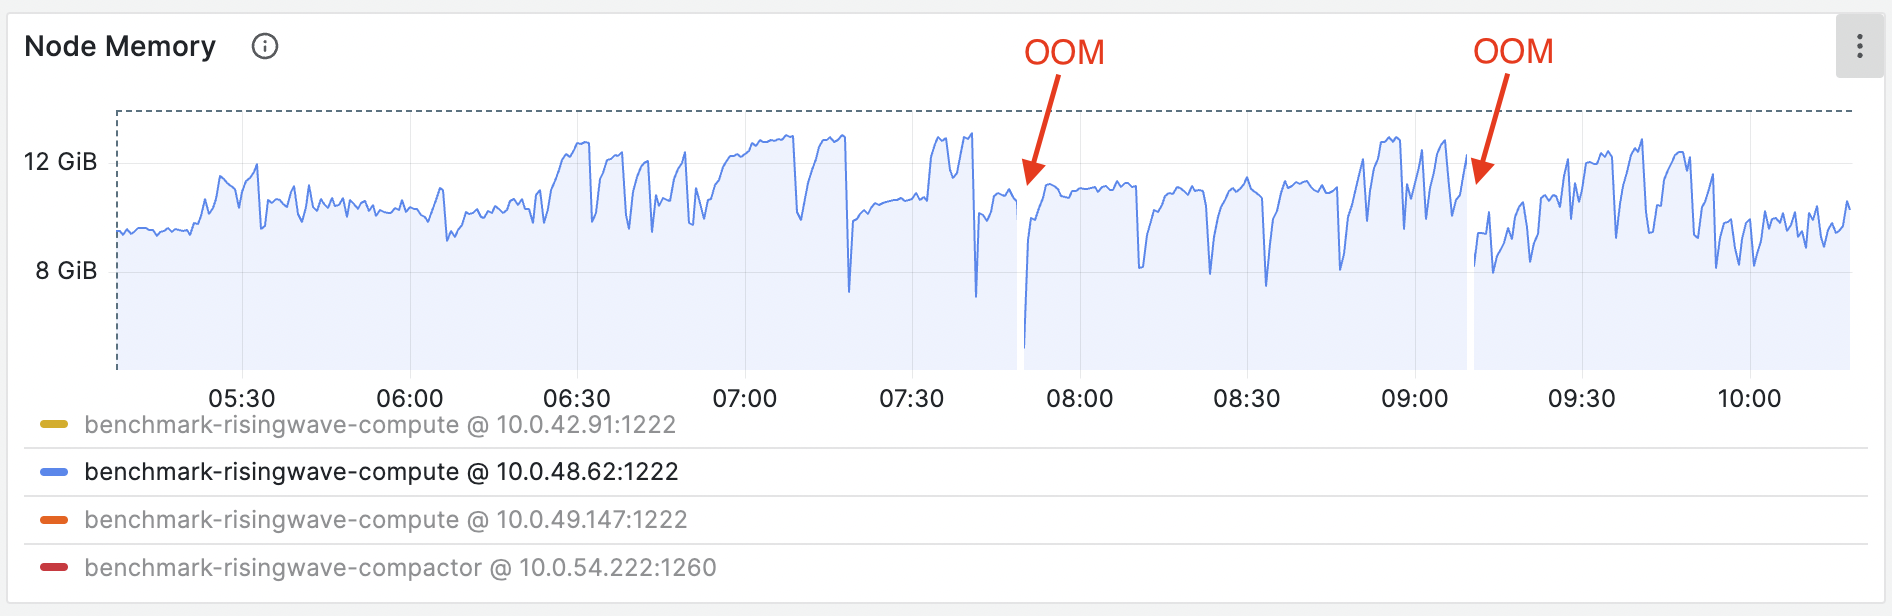
OOM symptoms
- The Kubernetes shows the Streaming Node pod suddenly restarts due to OOM Killed (137).
- The Grafana metrics show memory increases unbounded, beyond the limit of
total_memoryset for the Streaming Node. Memory settings can be found in the booting logs of the Streaming Node. Search for the keyword “Memory outline” to locate the specific section.
OOM when creating materialized views
If OOM happens during the creation of a new materialized view, it might be caused by the large amount of existing data in upstream systems like Kafka. In this case, before creating or recreating a materialized view, you can setstreaming_parallelism to a smaller number:
4 * source_rate_limit records/s.
Alternatively, you may use risectl to alter the streaming rate limit of an existent materialized view, where the <id> can be found either from the RisingWave Dashboard or rw_catalog schema.
OOM caused by extremely high barrier latency
Barriers play a vital role in our system, supporting the proper functioning of important components like memory management and LRU caches. Barrier latency can be observed from Grafana dashboard - Barrier latency panel. For example, the latency curve in the following figure is abnormal, which indicates that the barrier is getting stuck.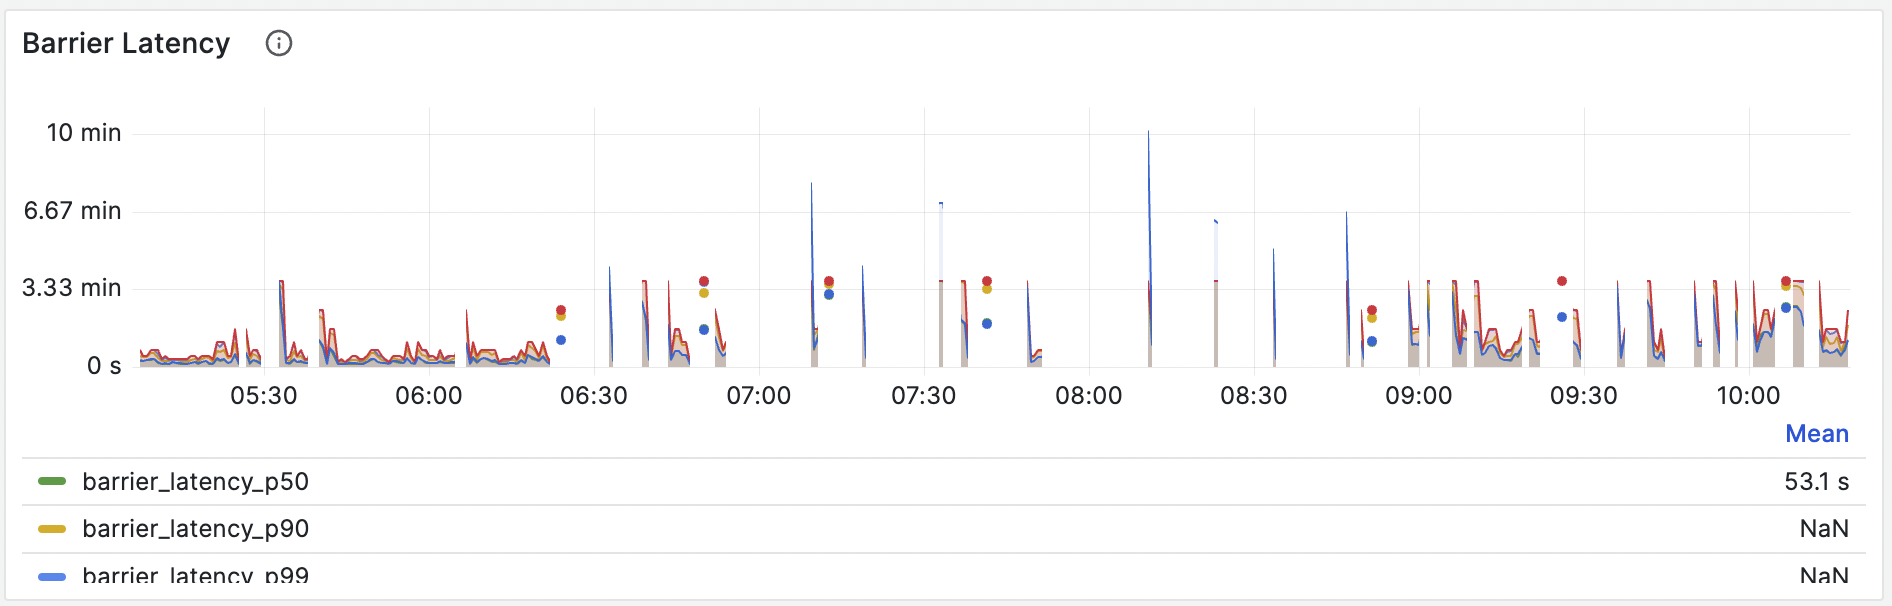
OOM during prefetching
If OOM occurs during long batch queries, it might result from excessive memory usage on Compute Nodes. In such a case, consider reducing the memory usage of prefetching by adjusting the value of thestorage.prefetch_buffer_capacity_mb parameter in the TOML file.
The storage.prefetch_buffer_capacity_mb configuration defines the maximum memory allowed for prefetching. It aims to optimize streaming executor and batch query performance through pre-reading. This feature allows hummock to read larger chunks of data in a single I/O operation, but at a higher memory cost. When the memory usage during prefetch operations reaches this limit, hummock will revert to the original read method, processing data in 64 KB blocks. If you set the parameter to 0, this feature will be disabled. By default, it is set to 7% of the total machine memory.
Troubleshoot using the memory profiling utility
If the barrier latency is normal, but the memory usage is still increasing, you may need to do memory profiling to identify the root cause. We have added a heap profiling utility in the RisingWave Dashboard to help you analyze memory usage and identify memory-related issues.To enable memory profiling, please set the environment variable
MALLOC_CONF=prof:true for the Compute Nodes.127.0.0.1:5691.
By default, the heap profile data is automatically dumped when the memory usage reaches 90%. You also have the option to manually dump heap profile data. Once the data is dumped, you can click on Analyze within the dashboard to examine memory usage patterns and potential issues without leaving the dashboard.
Ask in the community
To seek help from the community, you can join our Slack workspace and post your questions in the#troubleshooting channel. You may also file an issue in GitHub.
Please include the following details when you are reporting an issue:
- A summary of the issue.
- The steps to reproduce the issue.
- The related resources, such as logs, screenshots, metrics, stack dump, etc.