Overview

RisingWave uses Prometheus to collect the system metrics. Prometheus is a powerful monitoring platform that provides an end-to-end solution from instrumenting applications to querying metrics.

However, Prometheus’s local storage is limited to single-node durability and scalability. To replicate data from local storage to remote storage systems, we can use a proxy service that sends data in JSON format to Kafka. Then RisingWave can read, store, and perform complex queries on the data from Kafka.

There are numerous RisingWave system metrics that Prometheus collects. The most convenient method of tracking these metrics would be using a live dashboard. Luckily, since RisingWave is Postgres-compatible, we can use Grafana to visualize the metrics changing over time by creating dashboards.

In this tutorial, you will learn how to use RisingWave as a metrics store to monitor its runtime metrics and visualize them using Grafana.

Prerequisites

  • Ensure you have Docker and Docker Compose installed in your environment. Note that Docker Compose is included in Docker Desktop for Windows and macOS. If you use Docker Desktop, ensure it is running before launching the demo cluster.
  • Ensure that the PostgreSQL interactive terminal, psql, is installed in your environment. For detailed instructions, see Download PostgreSQL.

Step 1: Launch the demo cluster

In the demo cluster, we packaged RisingWave, Prometheus, and Grafana. Prometheus has been set up to collect metrics from RisingWave.

First, clone the risingwave repository to the environment.

git clone https://github.com/risingwavelabs/risingwave.git

Now navigate to the integration_tests/prometheus directory and start the demo cluster from the docker compose file.

cd risingwave/integration_tests/prometheus
docker compose up -d

COMMAND NOT FOUND?

The default command-line syntax in Compose V2 starts with docker compose. See details in the Docker docs.

If you’re using Compose V1, use docker-compose instead.

Necessary RisingWave components, Prometheus, and Grafana will be started. Prometheus will start collecting data from RisingWave and write them to Kafka topics. In this demo cluster, the data ingested from the Kafka topic will be stored in the MinIO instance.

Now connect to RisingWave to manage data streams and perform data analysis.

psql -h localhost -p 4566 -d dev -U root

Step 2: Connect RisingWave to data streams

Between Prometheus and Kafka, we use Prometheus-kafka-adapter, a proxy service that converts metrics into JSON and then sends them to a Kafka topic.

Here is a sample JSON:

{
  "labels": {
    "__name__": "prometheus_template_text_expansions_total",
    "instance": "prometheus-0:9500",
    "job": "prometheus"
  },
  "name": "prometheus_template_text_expansions_total",
  "timestamp": "2022-10-26T01:46:37Z",
  "value": "0"
}

Once the Kafka topic is ready, we can prepare the RisingWave SQL pipeline. The following SQL statement registers the Kafka topic to RisingWave.

CREATE SOURCE prometheus (
    labels STRUCT <
        __name__ VARCHAR,
        instance VARCHAR,
        job VARCHAR
    >,
    name VARCHAR,
    timestamp TIMESTAMP WITH TIME ZONE,
    value VARCHAR
) WITH (
    connector = 'kafka',
    topic = 'prometheus',
    properties.bootstrap.server = 'message_queue:29092',
    scan.startup.mode = 'earliest'
) FORMAT PLAIN ENCODE JSON;

We have connected RisingWave to the streams, but RisingWave has not started to consume data yet. For data to be processed, we need to define materialized views. After a materialized view is created, RisingWave will begin to consume data from the specified offset.

Step 3: Create a materialized view

Now, create a materialized view that tracks the average metric values every 30 seconds. We will split the stream into 30 seconds windows and calculate the average metric value over each window. Here we use the tumble window functionality to support window slicing.

CREATE MATERIALIZED VIEW metric_avg_30s AS
SELECT
    name AS metric_name,
    window_start AS metric_time,
    avg(value :: decimal) AS metric_value
FROM
    tumble(
        prometheus,
        timestamp,
        interval '30 s'
    )
GROUP BY
    name,
    window_start
ORDER BY
    window_start;

Here is an example result.

SELECT * FROM metric_avg_30s LIMIT 5;

               metric_name               |        metric_time        |          metric_value
-----------------------------------------+---------------------------+--------------------------------
 frontend_latency_local_execution_bucket | 2023-12-13 10:00:00+00:00 |                              0
 etcd_snap_fsync_duration_seconds_sum    | 2023-12-13 10:00:00+00:00 |                              0
 prometheus_api_remote_read_queries      | 2023-12-13 10:00:00+00:00 |                              0
 etcd_server_leader_changes_seen_total   | 2023-12-13 10:00:00+00:00 |                              1
 process_virtual_memory_bytes            | 2023-12-13 10:00:00+00:00 | 4224736530.7317073170731707317

Step 4: Add RisingWave as a data source in Grafana

Trying to track how a specific metric changes over time without a dashboard is difficult so we will use Grafana to visualize the metrics to make this easier.

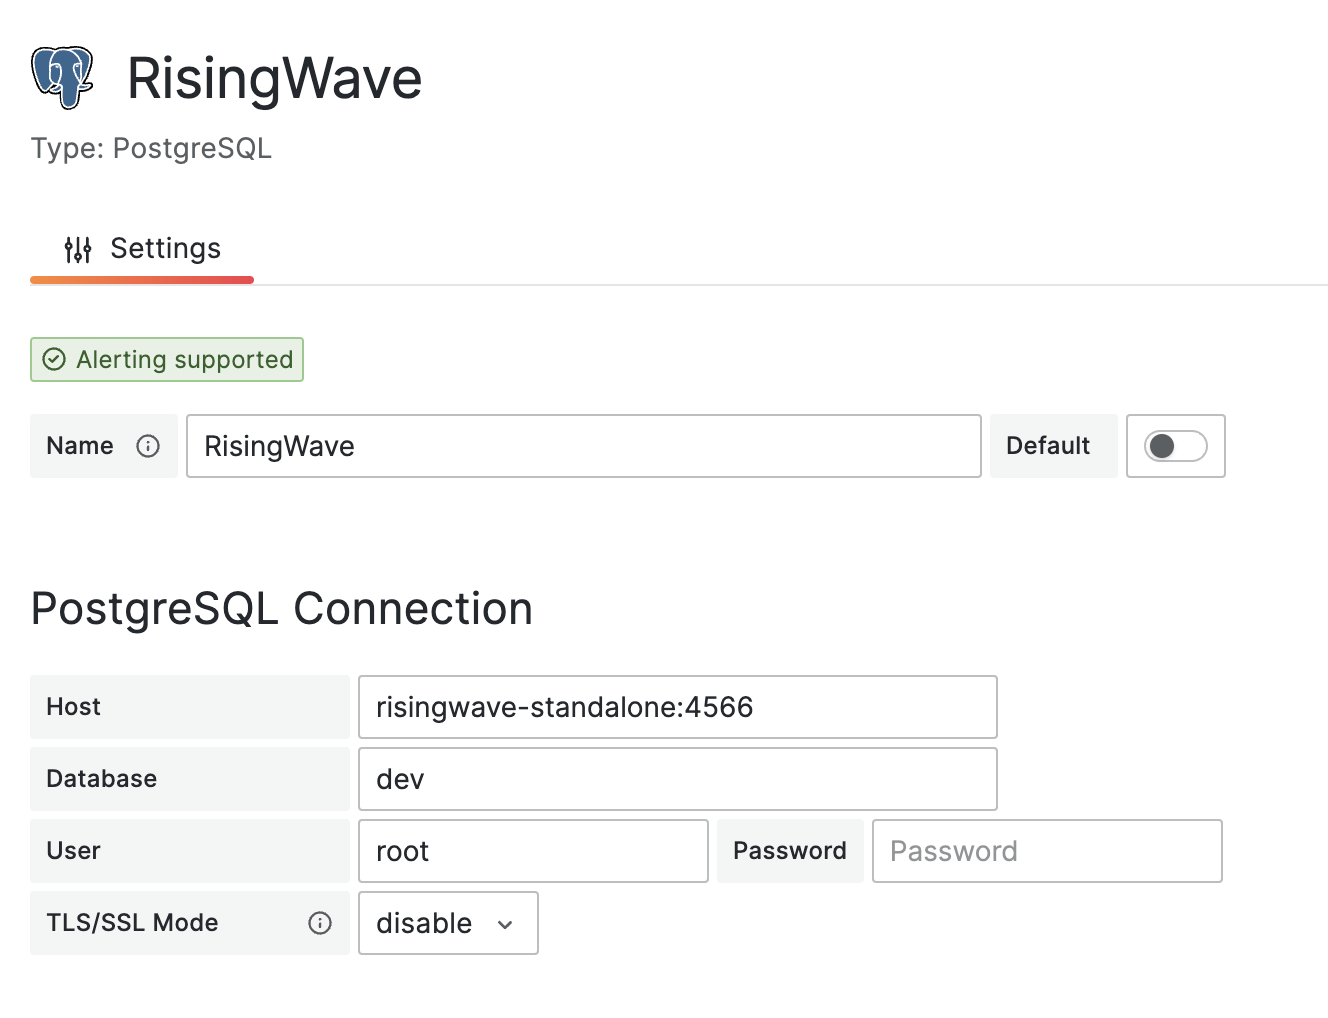
Grafana is packaged in the demo cluster and running. To visit Grafana, enter 127.0.0.1:3001 in your web browser. Since RisingWave is Postgres-compatible, RisingWave directly connects to Grafana with the built-in Postgres connector.

To add RisingWave as a Postgres data source:

  1. Go to Configuration > Data Sources.
  2. Click Add data source and select PostgreSQL.
  3. Specify the database connection parameters.
  4. Click Save & test.

This example uses RisingWave’s “root” user for testing purposes. While in the production environment, it is recommended to use a dedicated read-only user when querying the database using Grafana. To do so, use the following SQL queries:

CREATE USER grafanareader WITH PASSWORD 'password';
GRANT SELECT ON MATERIALIZED VIEW metric_avg_30s TO grafanareader;

Step 5: Visualize RisingWave metrics through Grafana

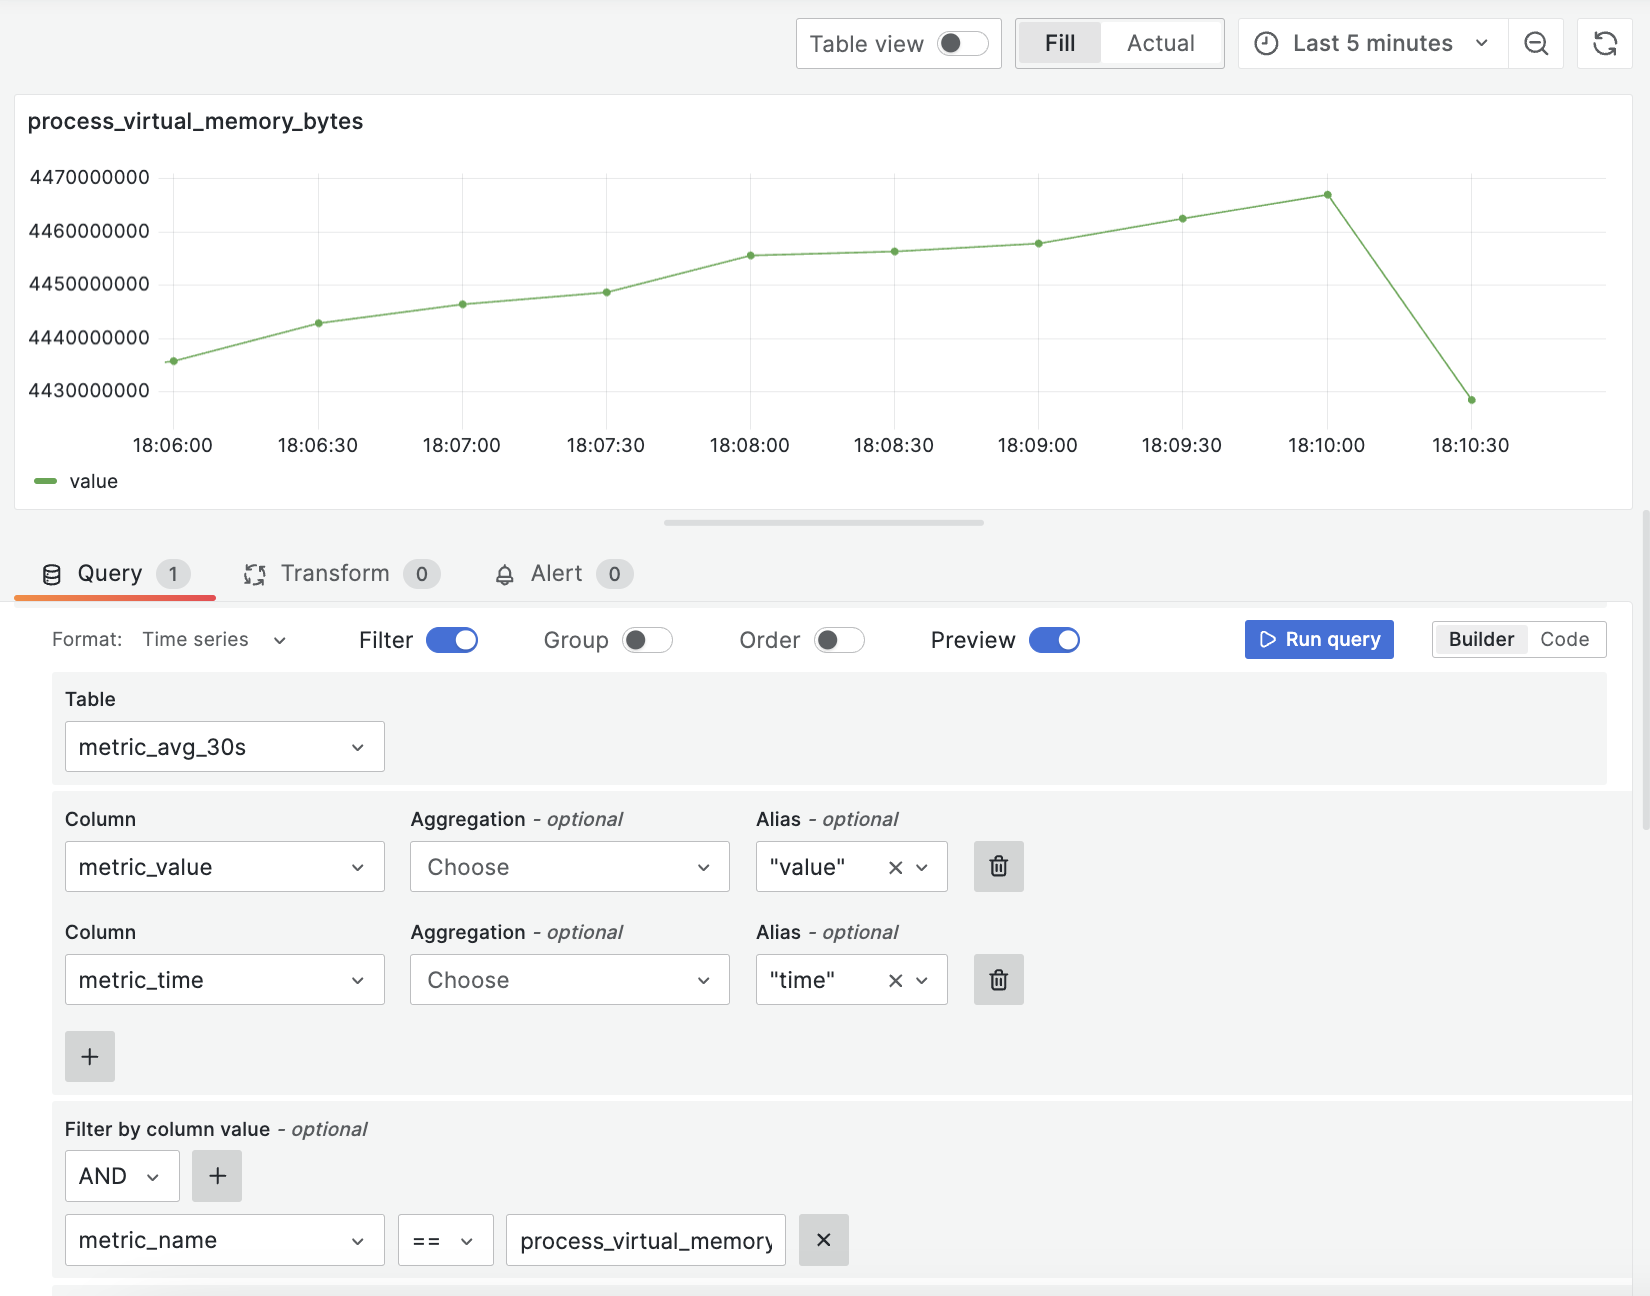
Finally, we can visualize the metrics the materialized view tracks by creating a data panel.

To create a panel:

  1. In Grafana, go to Dashboards > New dashboard.
  2. Click on Add a new panel.
  3. Specify the time range, data source, and query to visualize RisingWave metrics.
When you finish, run the following command to disconnect RisingWave.

\q

Optional: Remove the containers and the data generated with the following command.

docker compose down -v

Summary:

In this demo, we learned:

  • How to set up the data flow of RisingWave → Prometheus → Kafka → RisingWave.
  • How to visualize RisingWave’s computed results via Grafana.