Symptoms
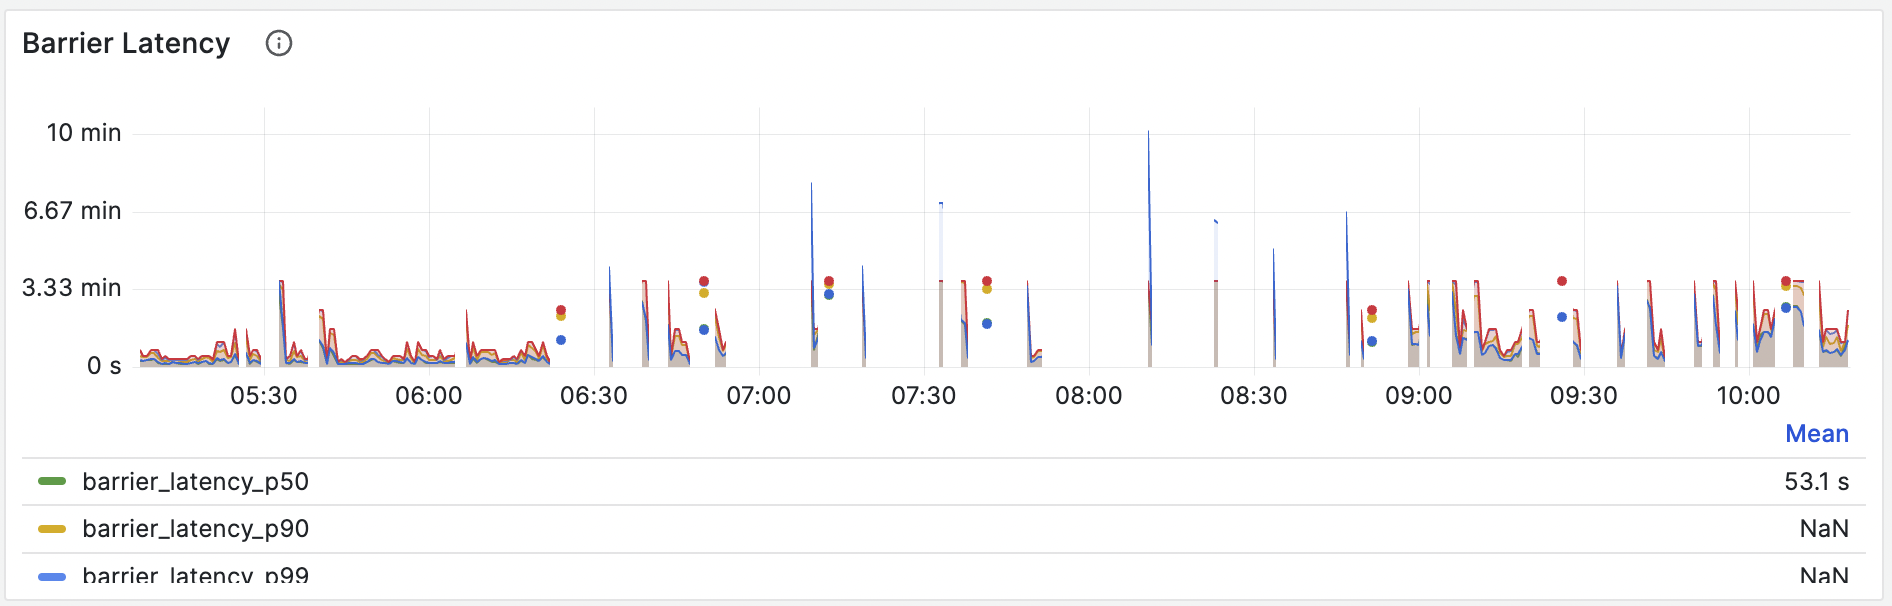
Several symptoms can indicate high latency and slow stream processing:- High barrier latency: Examine the Barrier Latency panel in the Grafana dashboard (dev) > Streaming section. A consistently high latency curve indicates that barriers are getting stuck, signifying a slowdown in the streaming pipeline. See Monitoring and metrics - Barrier monitoring for details.
- Backpressure: Observe the Actor Output Blocking Time Ratio (Backpressure) panel in Grafana dashboard (dev) > Streaming Actors. High backpressure between fragments indicates that a downstream component is unable to keep up with the upstream data flow. See Workload analysis for more details.
- Low source throughput: Check Source throughput to see if the input is the cause. Low throughput from the source, without significant backpressure, often indicates a problem with the upstream system itself.
- Data lag: If RisingWave is falling behind in processing data, this indicates a slowdown. This might be observed as a growing delay between when data is generated in the upstream source and when it’s reflected in RisingWave’s materialized views.
- Increasing number of barriers: A steadily increasing number of uncollected barriers is a sign of processing delays.
Potential causes
High latency and slow stream processing can be caused by a variety of factors. These factors often interact, so you may need to investigate multiple potential causes:Backpressure
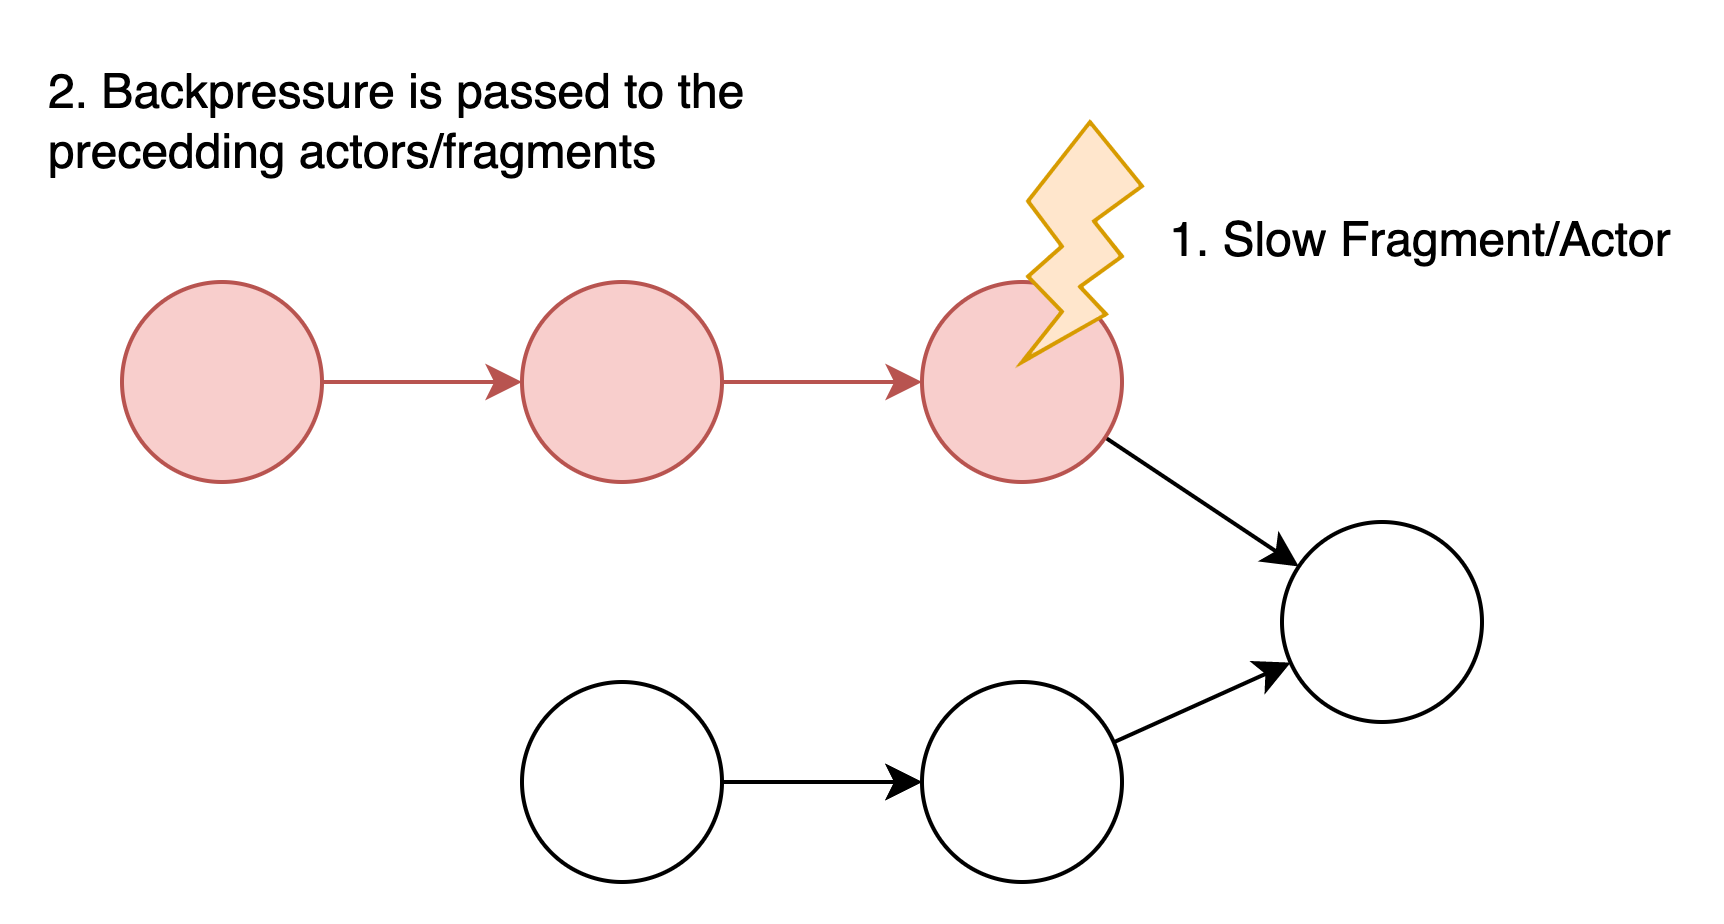
When a downstream actor or fragment processes data slower than its upstream counterpart, it creates backpressure. This pressure propagates upstream, eventually causing the source to slow down its data ingestion. Backpressure is often a symptom of an underlying issue (like resource constraints or an inefficient query), but it can also be a cause of further slowdowns.Resource constraints (CPU, memory, disk I/O)
Insufficient CPU, memory, or disk I/O resources can significantly limit the processing capacity of your streaming jobs. If RisingWave doesn’t have enough resources, it will take longer to process data. See Monitoring and metrics - Resource utilization, Best practices - Resource allocation, and Specific bottlenecks for more information.Slow upstream sources
If RisingWave is ingesting data from a slow upstream source (e.g., a message queue with limited bandwidth or a slow database), this can create a bottleneck regardless of RisingWave’s internal performance.Network issues
Network connectivity problems between RisingWave components or between RisingWave and external systems (e.g., S3, the upstream source, message queues) can introduce delays.Inefficient queries
Poorly written SQL queries used to create materialized views or sources can significantly impact streaming performance. Common issues include:- Heavy aggregations: Functions like
array_aggcan be computationally expensive, especially with large datasets or high cardinality grouping. - Joins with unreasonable amplification: Joining tables on low-cardinality columns (columns with few distinct values) can result in a massive increase in the number of rows processed, slowing down the join operation.
The term “Cardinality” describes how many distinct values exist in a column. For example, a “nation” column often has a lower cardinality, while a “user_id” column often has a higher cardinality. When using a low-cardinality column as the equal condition for a join, such as
A join B on A.nation = B.nation, any operation on a row in A or B will be amplified by the join, potentially leading to performance issues.- Using
UNIONinstead ofUNION ALL: TheUNIONoperator removes duplicate rows, which requires extra processing. If you don’t need to deduplicate rows, useUNION ALLfor significantly better performance. - UDF performance issues: Slow User-Defined Functions (UDFs) can become a bottleneck.
- Improper configuration: Incorrect configuration settings can negatively impact performance.
Diagnosis
General approach
- Check barrier latency and number: Start by examining the “Barrier Latency” and “Barrier Number” panels in Grafana, as described in the “Symptoms” section.
- Analyze backpressure: Go to Grafana dashboard (dev) > Streaming Actors > Actor Output Blocking Time Ratio (Backpressure) panel and analyze backpressure between fragments. High backpressure points to a bottleneck in the downstream fragment.
-
Examine await tree dump: Check the Await Tree Dump of all Compute Nodes in RisingWave Dashboard hosted on
http://meta-node:5691. If the barrier is stuck, the Await Tree Dump will reveal which operation it’s waiting for, helping you pinpoint the problematic part of your streaming pipeline. To help identify bottlenecks in the await tree, you can use the Await-Tree Analyzer for analysis. This tool is also available for self-hosting, please consult the repository for setup instructions. - Examine resource utilization: Check CPU usage, memory usage, and cache miss ratios as described in Monitoring and metrics. This will help you identify potential resource constraints.
-
Simplify the query: If you suspect an inefficient query, try removing parts of the SQL query (e.g., individual
JOINclauses,WHEREconditions, or complex functions) to isolate the specific part causing the slowdown. - Check for errors: Examine RisingWave’s logs for any error messages.
Identifying specific causes
Identify back-pressured fragments
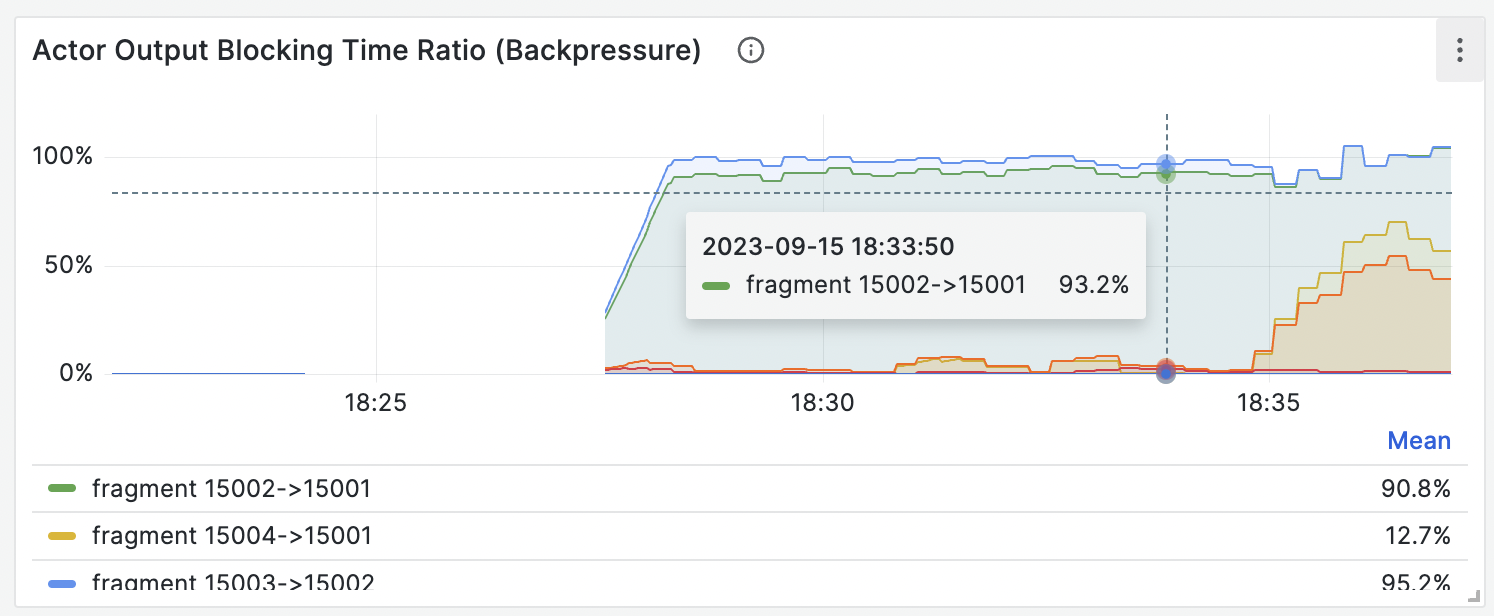
15002→15001 and 15003→15002 show high backpressure. Since backpressure propagates upstream, the root cause is likely fragment 15001.
To correlate this with your SQL query, use the RisingWave Dashboard and access the “Fragment” panel. You can also run EXPLAIN CREATE MATERIALIZED VIEW … to see the query plan and identify the part of the query corresponding to the problematic fragments.
Resource constraints
If you suspect resource constraints, refer to Specific bottlenecks for detailed guidance on diagnosing specific resource limitations (CPU, memory, storage, etc.). High CPU utilization, consistently high memory usage, or high cache miss ratios are key indicators.Slow upstream sources
If the Source throughput is lower than expected, and other metrics don’t indicate internal bottlenecks, the upstream source may be the limiting factor.Network issues
RisingWave does not have specific network metrics. If other metrics and the upstream source appear healthy, investigate potential network connectivity problems.Inefficient queries
Examine the SQL queries used to create your materialized views and sources. Look for the common issues listed under “Potential causes” above. Specifically, look for signs of high join amplification: You can find this panel through Grafana dashboard (dev) > Streaming > Join Executor Matched Rows, which indicates the number of matched rows from the opposite side in the streaming join executors.
high_join_amplification with the problematic join keys will be printed, such as
Solutions
General strategies
- Optimize queries: The most effective way to improve performance is often to improve the efficiency of your SQL queries used to create materialized views and sources. See Best practices - Query optimization for general guidance.
- Increase resources: If resource constraints are the issue, consider scaling up (adding more resources to existing nodes) or scaling out (adding more nodes). See Best practices - Resource allocation.
- Address upstream bottlenecks: If the upstream source is slow, you’ll need to address the bottleneck in the upstream system itself.
- Address network issues: Troubleshoot network connectivity.
Specific solutions for each cause
Backpressure
- Rewrite queries: Simplify or optimize the queries used to create your materialized views and sources. Focus on reducing the load on the bottleneck fragments identified during diagnosis. This might involve restructuring joins, adding filters, or optimizing aggregations.
- Increase parallelism: If a specific fragment is a bottleneck due to computational limitations, increasing its parallelism (if possible) can help distribute the workload. See Best practices - Resource allocation.
- Address resource constraints: Underlying resource limitations can cause backpressure. See Specific bottlenecks for detailed guidance.
Resource constraints
Increase CPU, memory, or disk cache (if available). See Best practices - Resource allocation and Specific bottlenecks for detailed guidance.Slow upstream sources
Address the bottleneck in the upstream system (e.g., increase resources for your message queue or database).Network issues
Troubleshoot network connectivity between RisingWave components and external systems.Inefficient queries
- Reduce join amplification:
- Rewrite the query: Use better join conditions or restructure your query to minimize the number of rows produced by joins. See Maintain wide table with table sinks for details.
-
Use the workaround: If you have identified specific join keys causing high amplification, you can split the original materialized view into multiple materialized views with filtering conditions to distribute the workload:
For example, for this join:
If
product_id = 1is a hot-selling product causing amplification, split the materialized view:- Create one MV with
orders.user_id % 7 = 0. - Create another with
orders.user_id % 7 = 1. - Repeat up to
orders.user_id % 7 = 6.
user_idis not directly usable with modulo, use a hash function:hash_value(orders.user_id). Account for negative hash values:hash_value(orders.user_id) % 7 = -1/-2/-3/-4/-5/-6. Finally,UNION ALLthe results from all the materialized views. - Create one MV with
- Optimize heavy aggregations: Consider alternative aggregation strategies, pre-aggregate data if possible, or use approximations if acceptable for your use case.
- Use
UNION ALLinstead ofUNION: If you don’t need to deduplicate rows, useUNION ALL. - Improve UDF performance: Optimize your UDF code or consider alternative approaches if UDFs are a bottleneck.