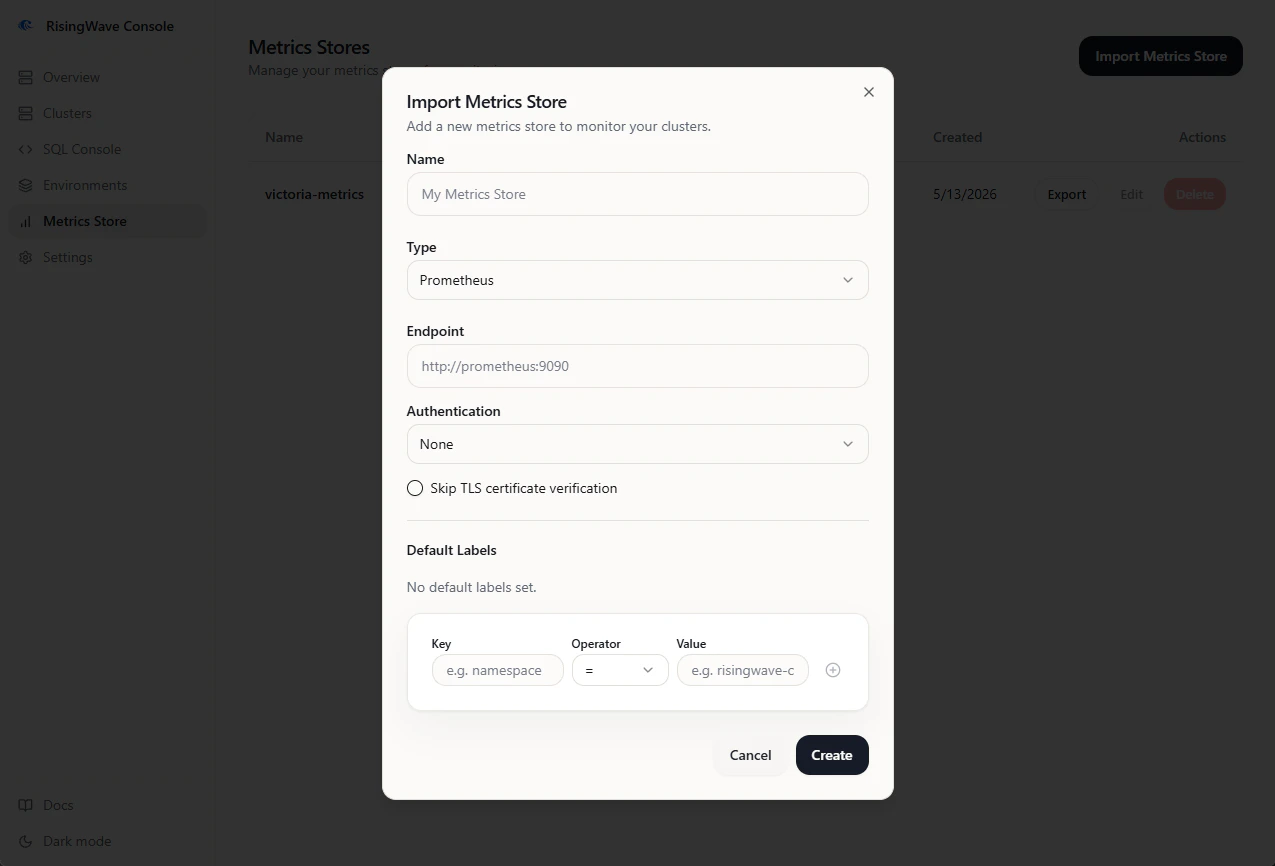
Add a metrics store
- Open Metrics Store from the sidebar.
- Click Add.
- Enter a name.
- Select the metrics store type.
- Enter the endpoint URL.
- Add any default labels needed to scope queries, such as a Kubernetes namespace label.
- Save the store.
Managed metrics stores
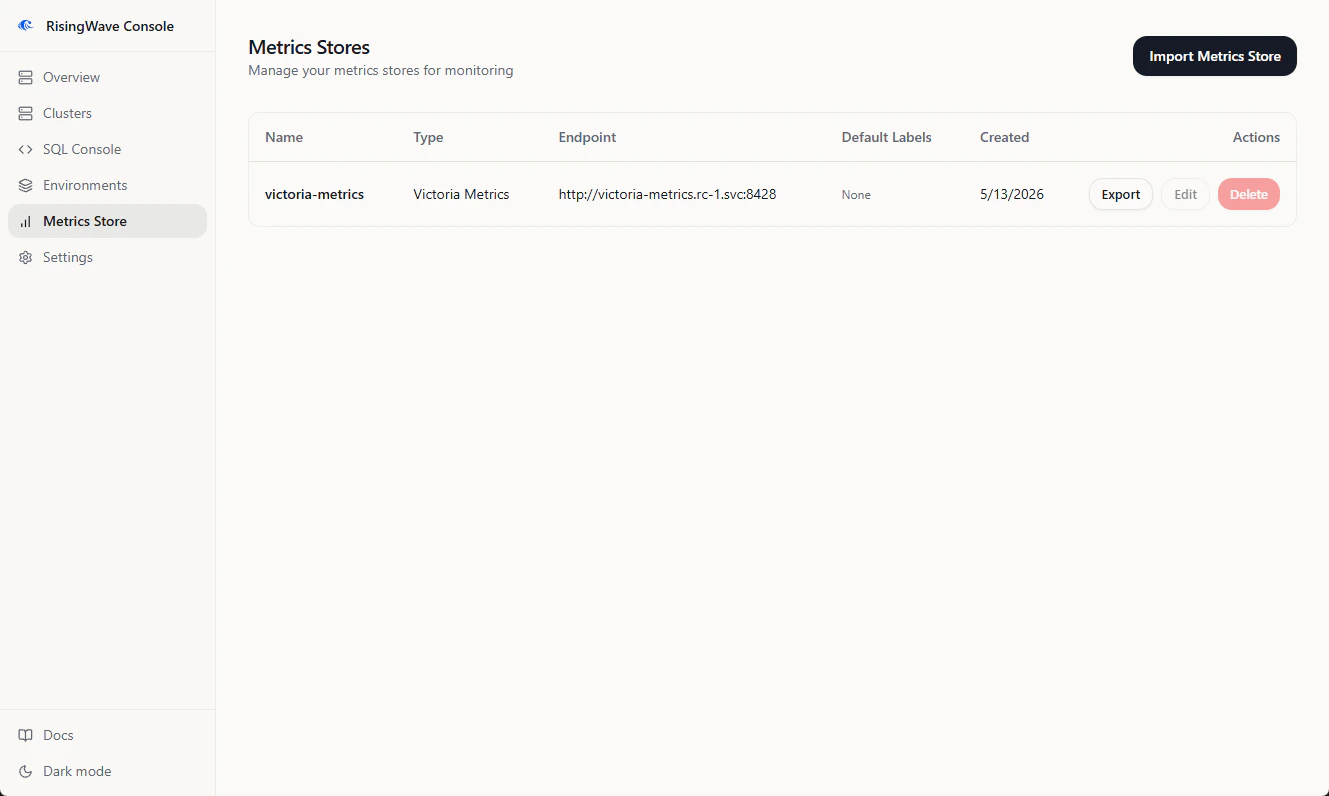
When an environment installs VictoriaMetrics, Console treats that metrics store as managed. Managed metrics stores are owned by the environment lifecycle and may not allow the same edit or delete actions as imported metrics stores.Export metrics
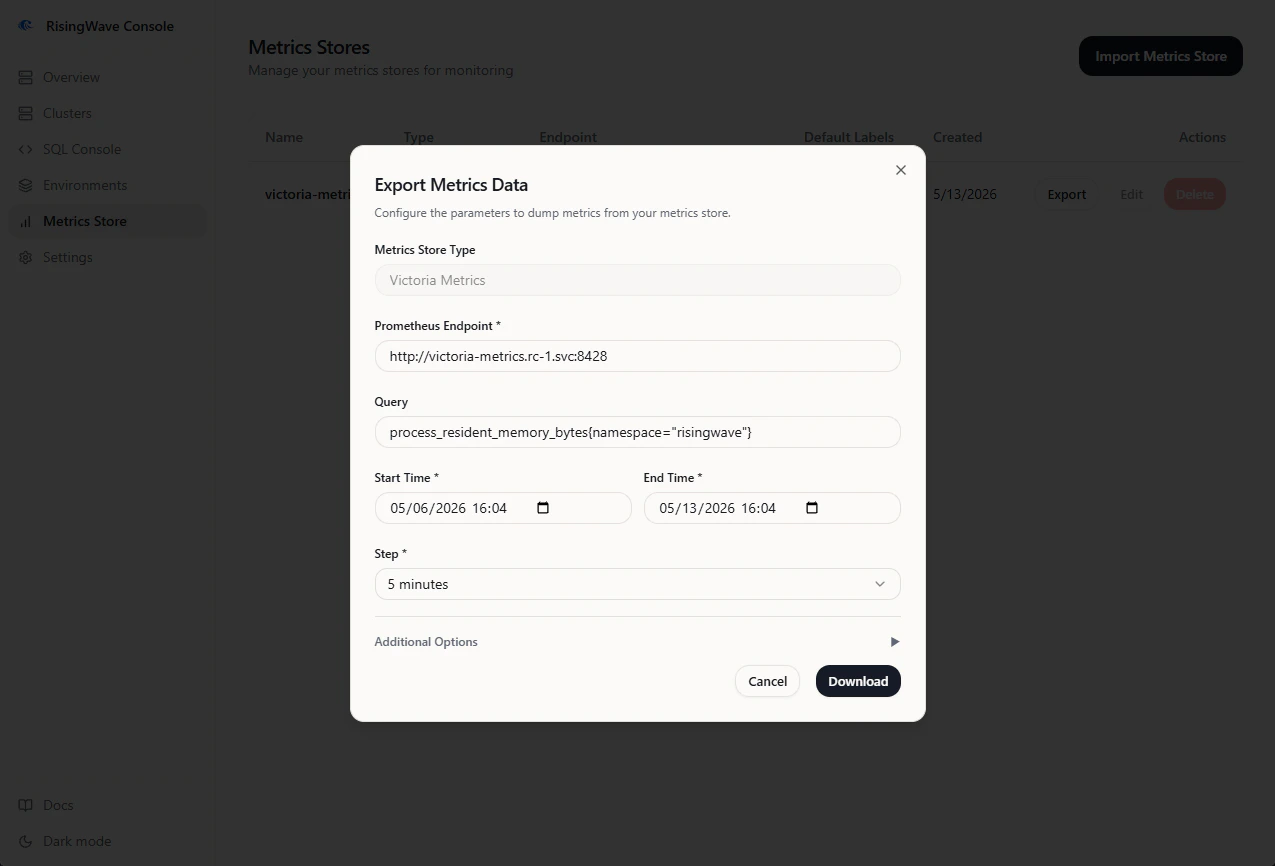
Console can export metrics from a metrics store as a ZIP archive for offline analysis or support handoff.- Open Metrics Store.
- Find the store.
- Click Export.
- Set Start Time and End Time. The UI accepts browser-local time and sends the request in UTC.
- Select Step. Smaller steps produce larger archives.
- Enter a PromQL selector, such as:
- Keep gzip compression enabled unless your downstream tooling cannot read compressed output.
- Click Download and keep the tab open until the export finishes.
metrics.zip.
Troubleshooting
| Symptom | Check |
|---|---|
| Metrics charts are empty | Confirm the cluster has a metrics store selected and the default labels match emitted series. |
| Export times out | Narrow the time range, increase the step, split into more parts, or reduce the memory ratio. |
| Export archive is empty | The query matched no series in the selected time range. |
| Managed metrics store cannot be deleted | It is owned by an environment. Delete or update the environment component instead. |