Prerequisites
Install and launch RisingWave
To install and start RisingWave locally, see the Get started guide. We recommend running RisingWave locally for testing purposes. Connect to streaming sources. For details on connecting to a streaming source and what connectors are supported with RisingWave, see CREATE SOURCE.Install and launch Grafana
To install Grafana locally, see the Install Grafana guide. Next, to start Grafana, follow the Sign in to Grafana step of the Build your first dashboard guide.Establish a connection between RisingWave and Grafana
Add RisingWave as a data source
- Go to Configuration > Data source.
- Click the Add data source button.
- Select PostgreSQL from the list of supported databases.
- Fill in the PostgreSQL Connection fields like so:
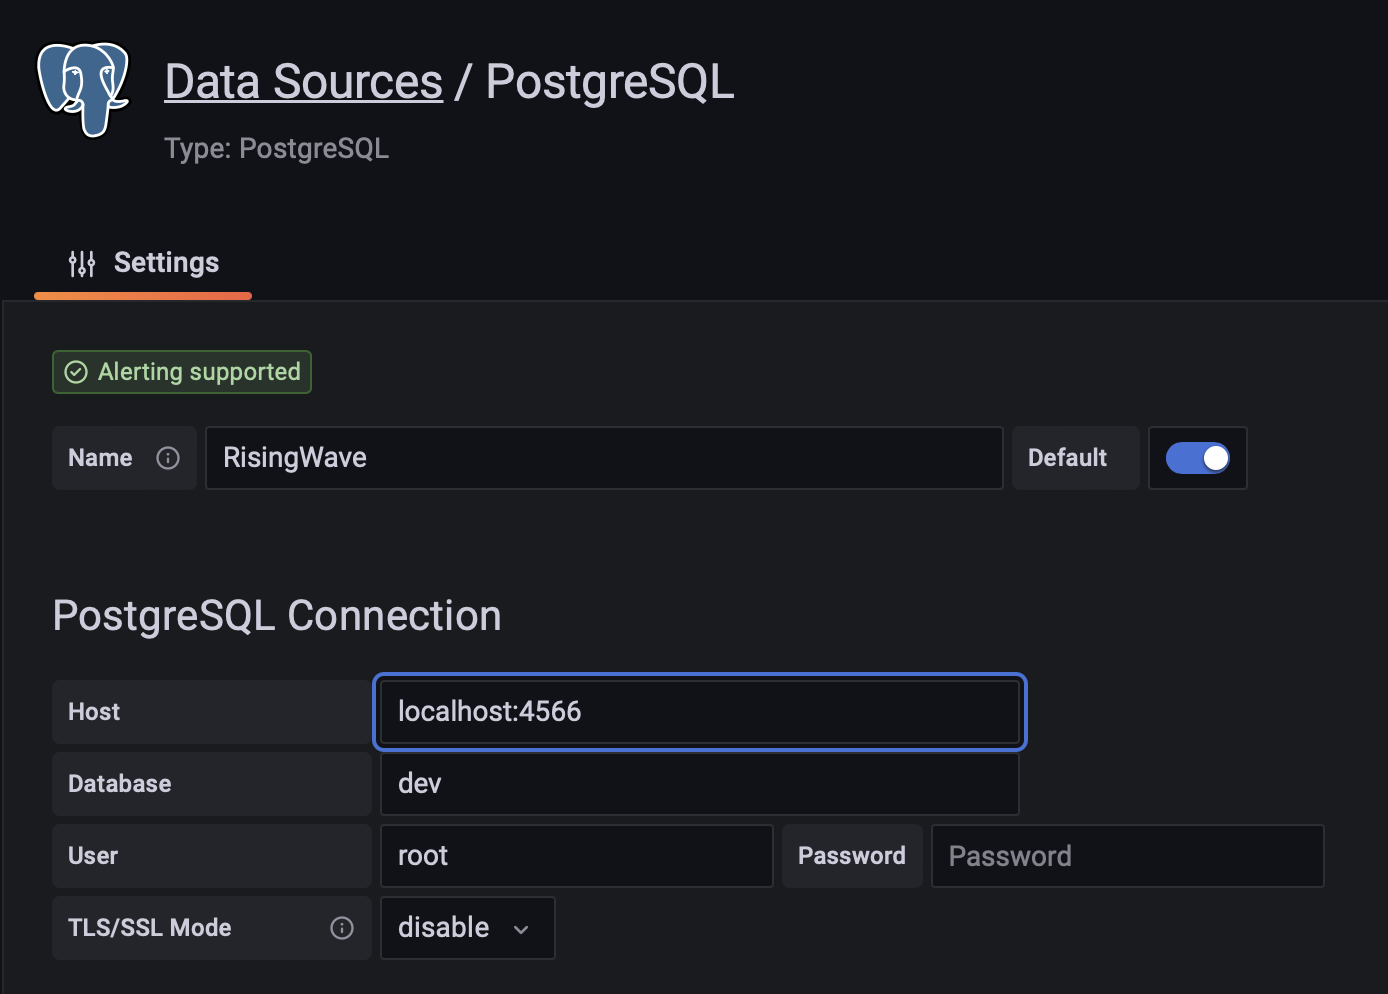
If both RisingWave and Grafana are started locally, the host domain can be either localhost:4566 or 127.0.0.1:4566.If you are running Grafana Cloud, the host domain should be your computer’s public IP address.
- Click Save & test.
root user. In production, it is recommended to use a dedicated read-only user when querying the database using Grafana.
To add a new read-only user, use the following SQL query:
Configure Grafana to read data from RisingWave Cloud
Grafana can also be configured to visualize and monitor data from a RisingWave Cloud cluster, allowing you to build charts and real-time dashboards based on tables and materialized views. Follow these steps to integrate RisingWave as a data source in Grafana.Add RisingWave Cloud as a Data Source in Grafana
- Access Data Source Settings. In Grafana, navigate to Configuration > Data Sources from the left-hand sidebar.
- Add a New Data Source. Click the Add Data Source button at the top of the page.
- From the list of available database integrations, choose PostgreSQL. RisingWave is PostgreSQL-compatible, so this option works perfectly for connecting to it.
-
Configure PostgreSQL connection by filling in the following connection details based on your RisingWave Cloud cluster:
- Host: Provide the hostname of your RisingWave Cloud instance. The format will typically be something like:
your-rw-cluster-host-url:4566. - Database: Enter the database name as
dev. - User: Use the username associated with your RisingWave Cloud cluster.
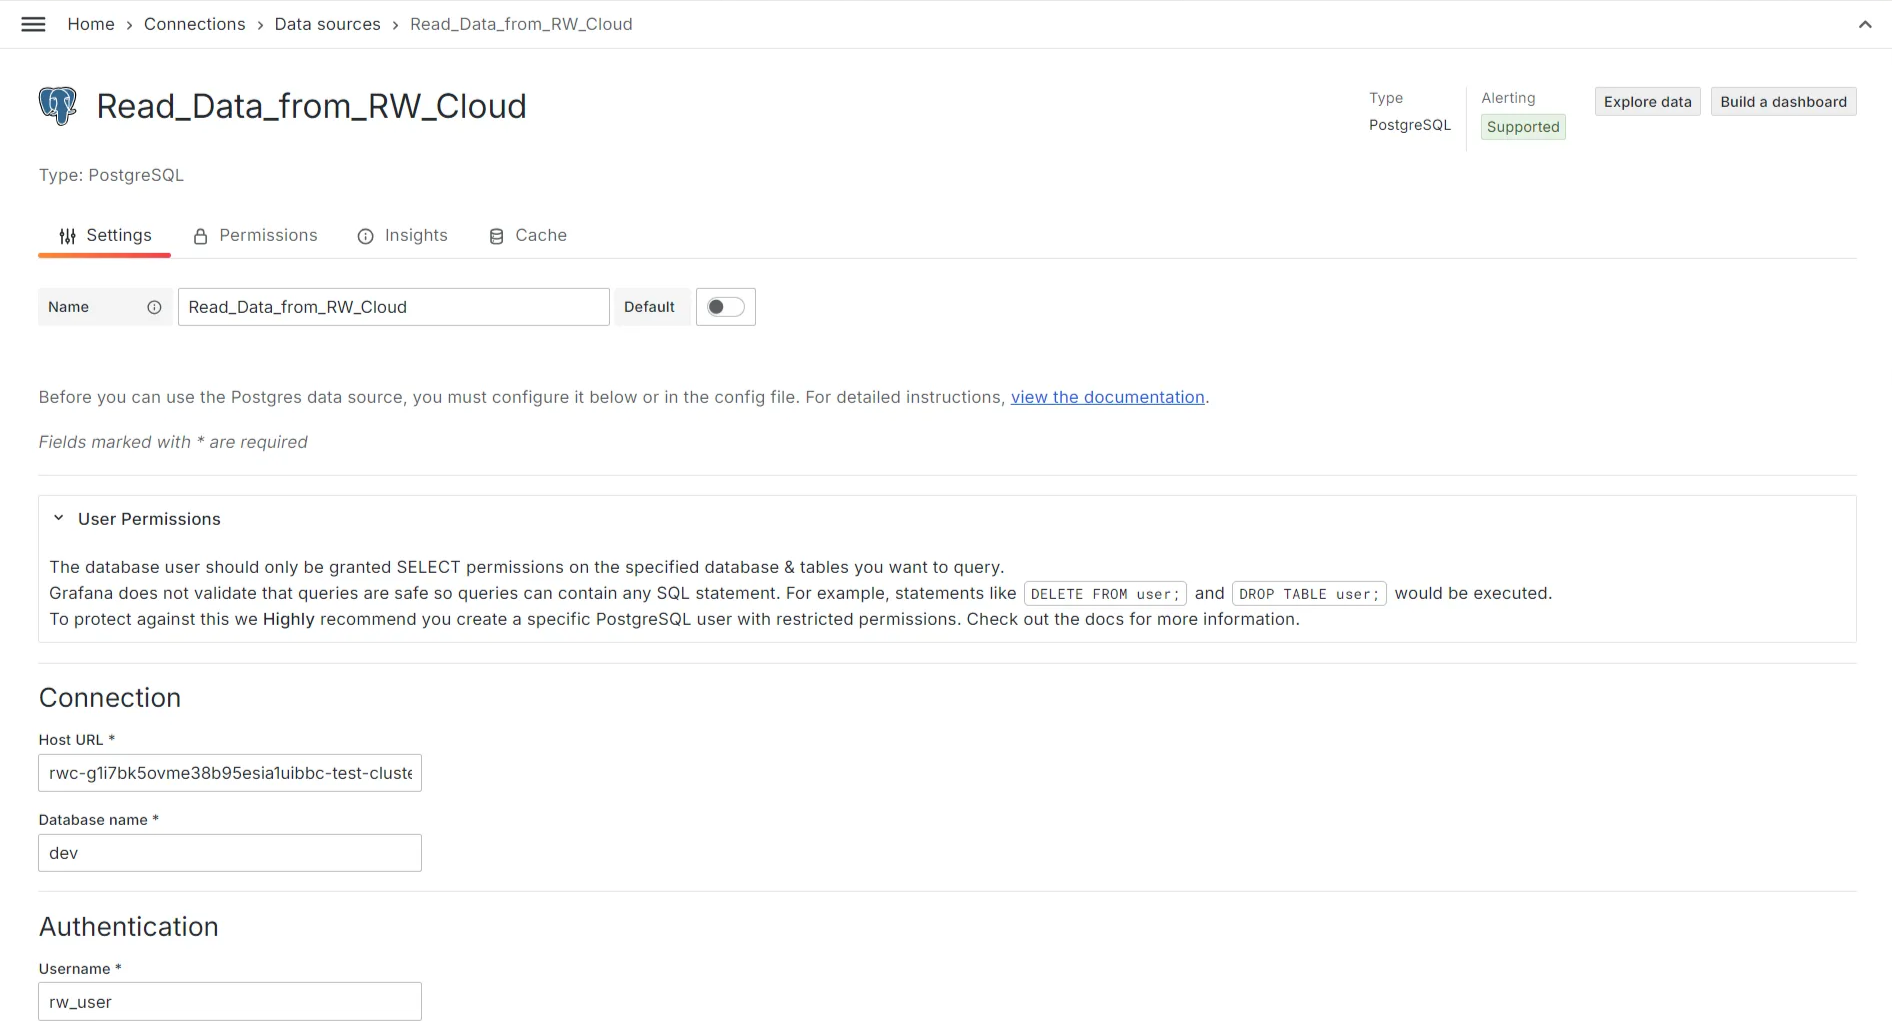
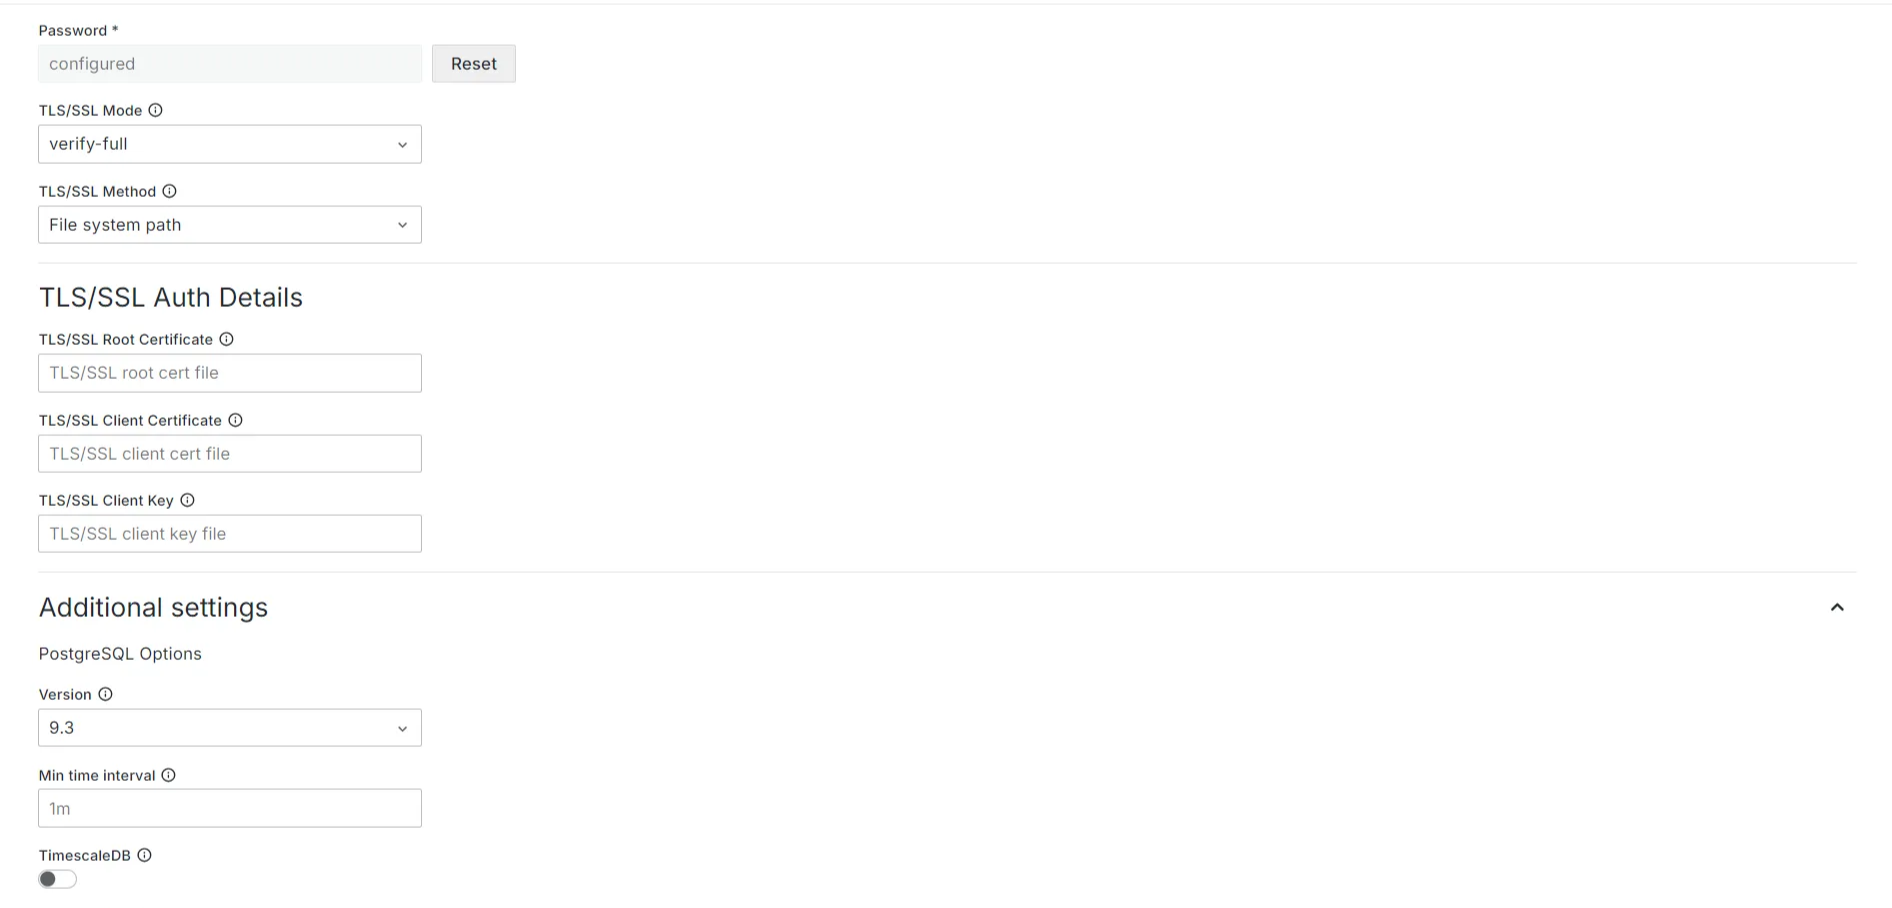
- Password: Enter the password for the corresponding username.
- TLS/SSL Mode: Set this to
verify-fullfor secure connections. This will ensure that data transferred between Grafana and RisingWave is encrypted and verified.
- Host: Provide the hostname of your RisingWave Cloud instance. The format will typically be something like:
-
Optional fields such as File System Path and Certificate Content can be left blank.
-
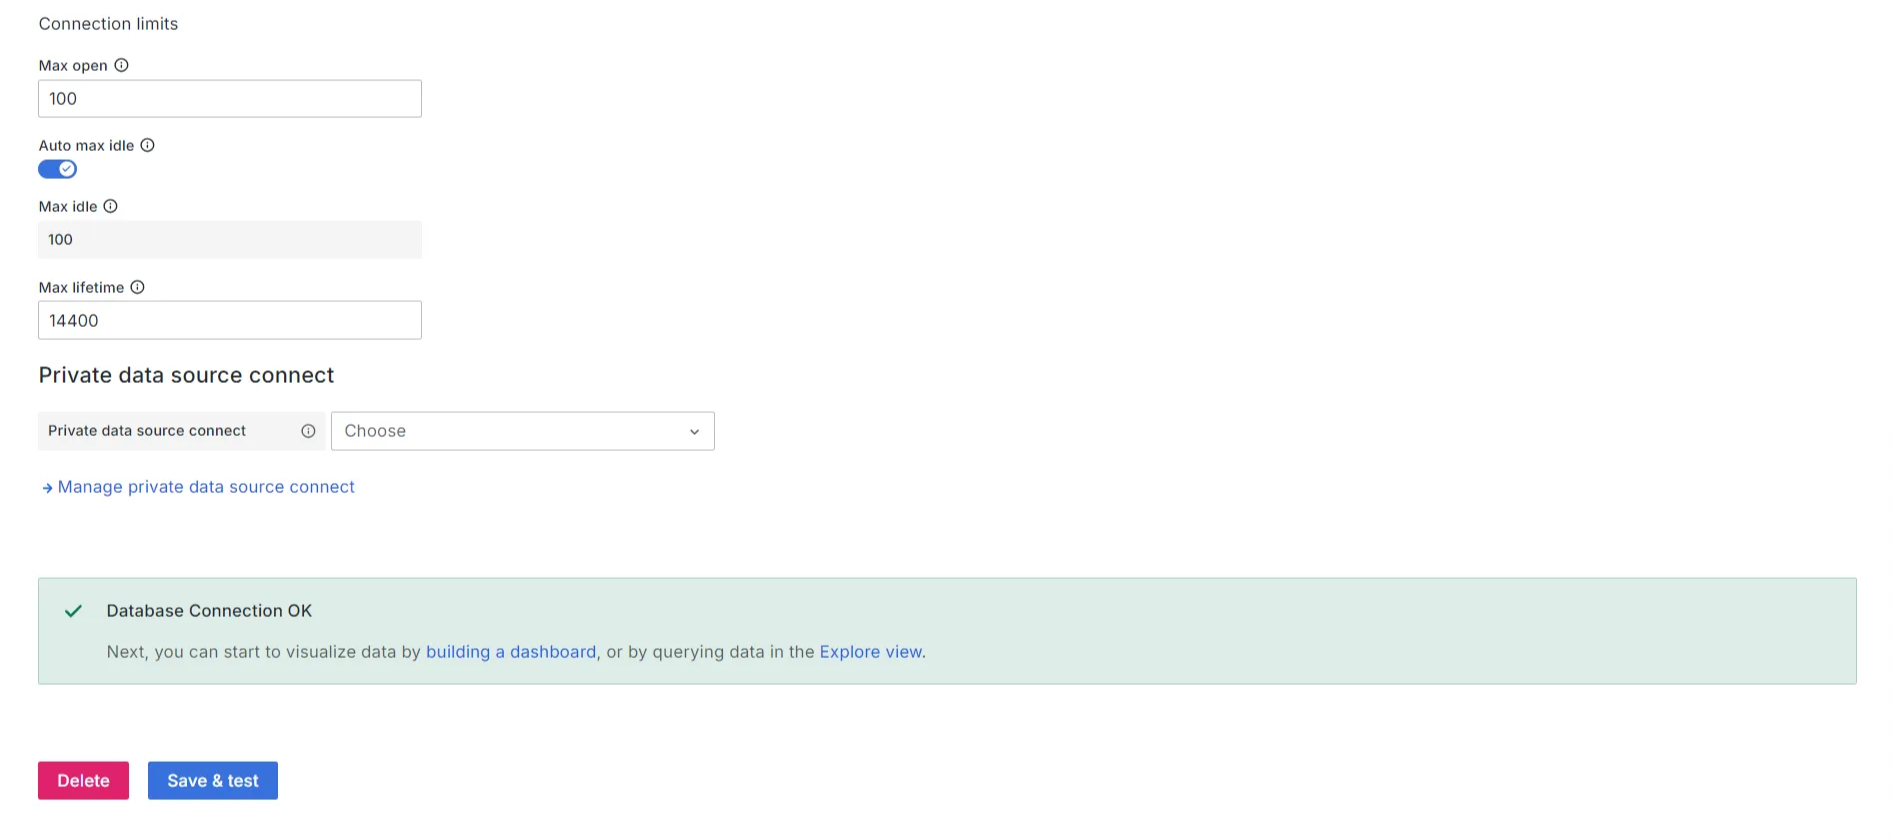
Test the Connection. Once you’ve entered the required fields, scroll down and click the Save & Test button to check the connection. If successful, Grafana will confirm that it can connect to your RisingWave Cloud instance.
Create dashboards and visualizations
After adding RisingWave as a data source, you can now create dynamic dashboards and real-time visualizations using tables and materialized views from your RisingWave Cloud cluster.- Start by creating a new dashboard. Go to Dashboards > New Dashboard and select Add New Panel.
- Use the Grafana query editor to write SQL queries that extract data from your RisingWave tables or materialized views. Since RisingWave is PostgreSQL-compatible, the query syntax will follow PostgreSQL standards.
- Visualize data. Choose from Grafana’s wide range of visualization options (e.g. time series, bar charts, tables) to represent your data in a meaningful way.